Start at the local mains frequency, but compare the candidate with adjacent FFT bins instead of judging its height alone.
50/60 Hz hum detector
Locate mains-hum candidates. Verify the pattern.
Screen an audio file for energy around 50 or 60 Hz and related harmonics. Use timestamps, spectrum shape, persistence, and listening together—because one low-frequency peak is not enough to diagnose electrical hum.
No server uploadListen before decidingMethod and limits stated
What strong evidence looks like
Fundamental, harmonics, persistence, and sound.
Look for supporting narrow peaks around 100/150 Hz or 120/180 Hz. A coherent family is stronger evidence than one peak.
Use the full-file spectrogram and timestamps to distinguish a continuous electrical pattern from changing machinery, speech, or handling noise.
How to inspect a recording
Use the detector as a lead, not a verdict.
- 01Load the original file
Use an unprocessed recording where possible. Noise reduction, high-pass filtering, and lossy encoding can alter the evidence.
- 02Inspect the bass range
Select a 4,096- or 8,192-point FFT and focus on 20–250 Hz to separate nearby low-frequency components more clearly.
- 03Check harmonics and time
Compare 50/60 Hz with neighbouring bins, look at exact multiples, and confirm that the pattern remains visible across the relevant passage.
- 04Listen and isolate the cause
Test power supplies, grounding, cable routing, nearby appliances, microphones, and interfaces one change at a time.
Real recording · negative finding
A fan recording that looked suspicious at first.
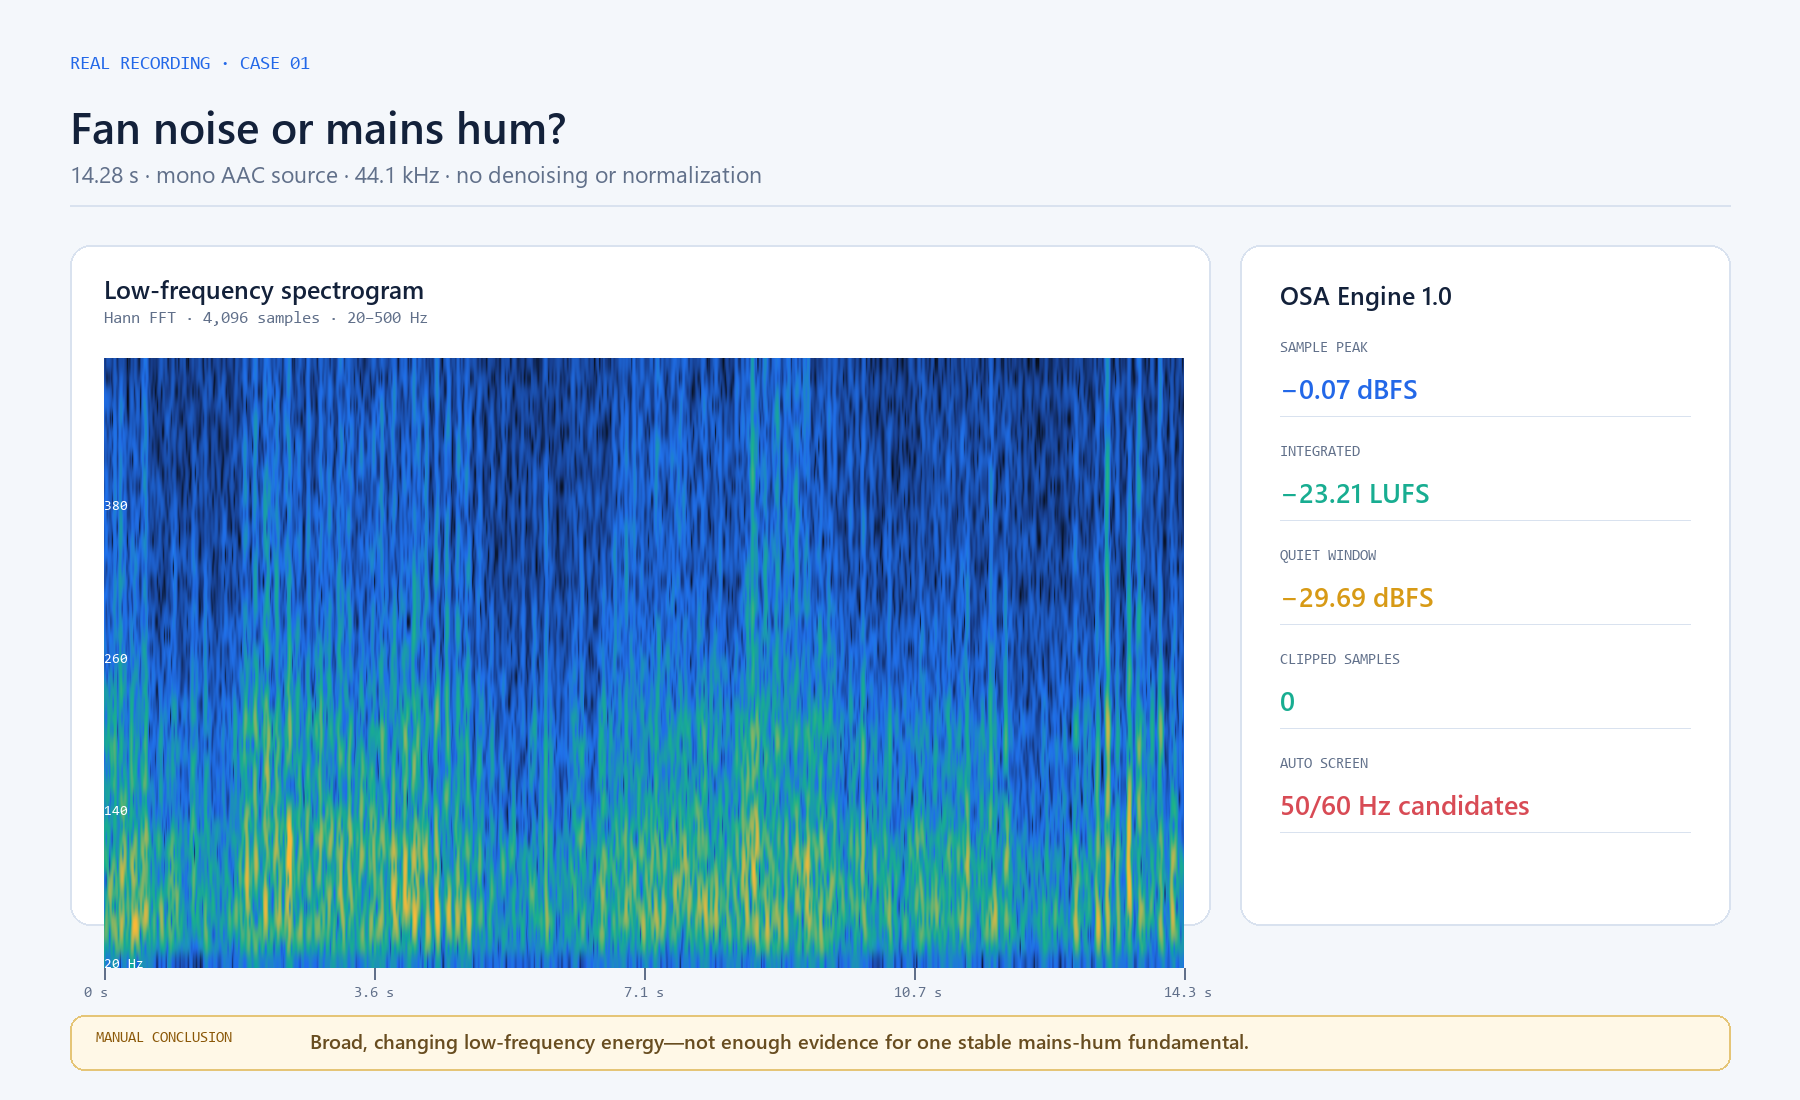
This 14-second M4A recording was made on a Samsung A55 placed close to an electric fan in a bedroom. Automated screening raised early 50/60 Hz candidates, so the full-file evidence was checked before assigning a cause.
ORIGINAL FIELD RECORDINGBedroom fan · 14.3 seconds
M4A/AAC · mono · 48 kHz source · phone placed close to the fan
CONCLUSION
Broad, changing low-frequency fan noise is present; stable mains hum is not established. The suspected fundamental was only about 1 dB above its local background in the whole-file view, and supporting harmonics were not stable enough over time.
Read the listening notes, measurements, and interpretation in the real fan-noise diagnosis.
Method and limits
Low-frequency energy has more than one possible cause.
Automated screening compares energy near 50 or 60 Hz and related harmonics with neighbouring frequencies over time.
False positives are possible. Musical bass, motors, HVAC equipment, wind, room modes, phone filtering, and handling noise can resemble part of a mains-hum pattern.
Acoustic and electrical diagnosis are different. The analyzer measures decoded digital audio in dBFS; it cannot identify a ground loop or report calibrated room sound level without controlled physical tests.
Read the full measurement methodologyCommon questions
Interpreting 50/60 Hz evidence.
Does a strong 50 Hz or 60 Hz peak prove mains hum?
No. Stronger evidence includes persistence over time and related narrow peaks at exact harmonic multiples. Mechanical noise, bass content, handling, and room response can occupy the same region.
Why does electrical hum have harmonics?
The interference and affected equipment rarely behave as a perfect sine wave. Their waveform can produce energy at integer multiples such as 100 and 150 Hz or 120 and 180 Hz.
Can the analyzer tell whether the cause is a ground loop?
It can reveal a pattern consistent with mains-related interference, but the graph alone cannot identify the physical cause. Cable, power, grounding, and equipment tests are still required.
Private browser analysis
Open the analyzerInspect your own recording.
Load an audio file, review the visual evidence, and confirm important passages by listening.