Time runs left to right
Locate when a note begins, a click occurs, speech changes, or background noise enters the recording.
See where tones, harmonics, speech, hum, noise, and short events occur—not just which frequencies exist. Analyze an audio file or follow live microphone input as it changes.
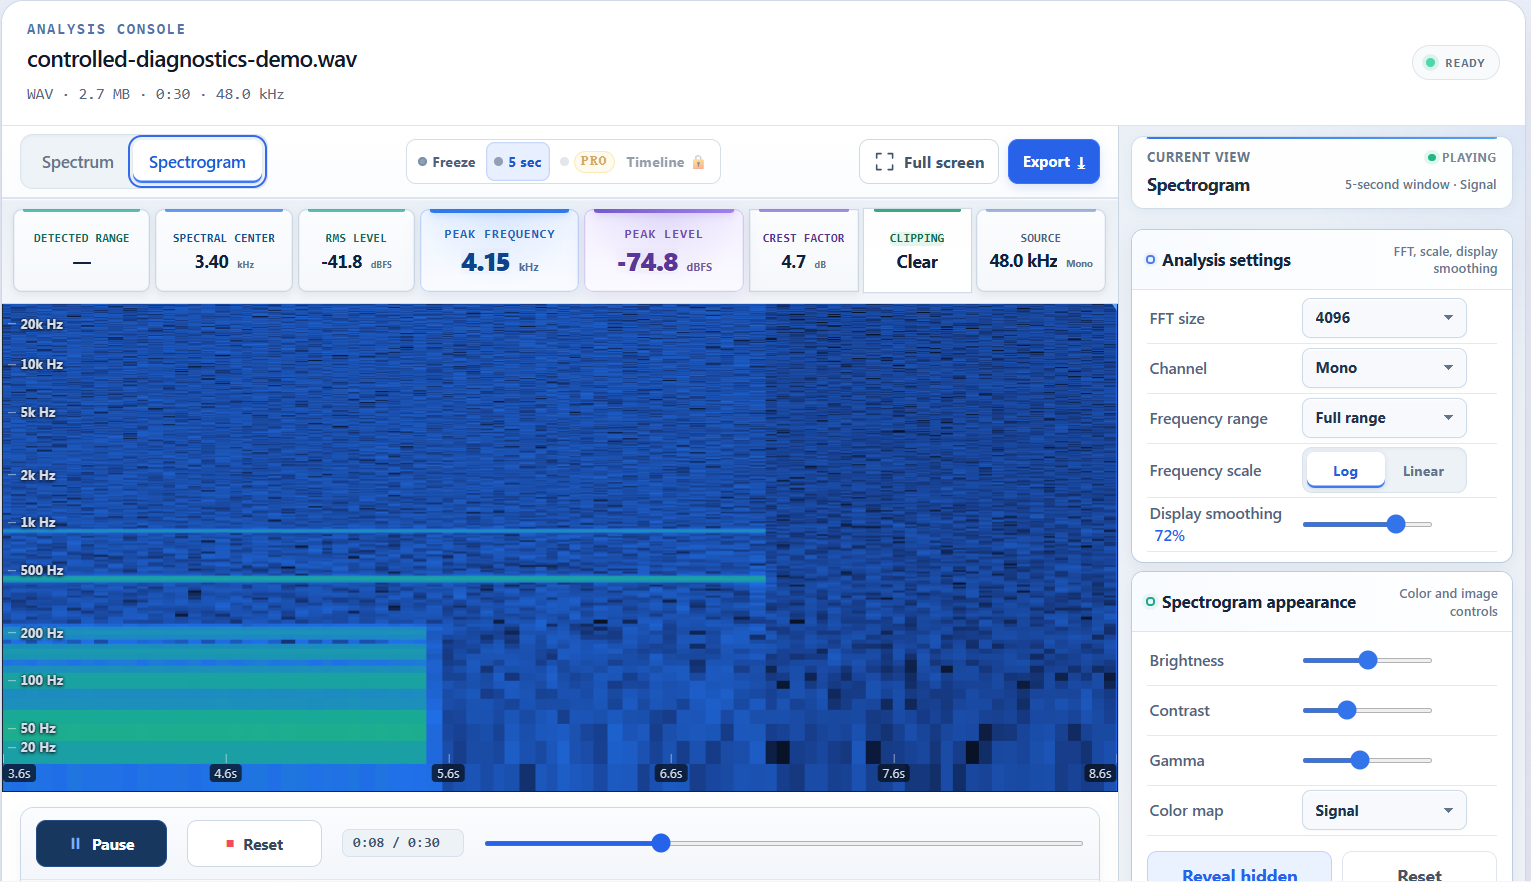
A spectrum captures one moment. A spectrogram keeps those moments in order, making change visible.
Locate when a note begins, a click occurs, speech changes, or background noise enters the recording.
Low-frequency rumble sits near the bottom. Fundamentals and harmonics form horizontal bands above it.
Brighter areas indicate stronger energy under the current brightness, contrast, gamma, and color-map settings.
Start with the defaults. Change a setting only when the question you are investigating requires it.
Upload MP3, WAV, FLAC, M4A, or OGG, try the sample, or start the microphone.
Press Play for a file. The image advances in sync with the sound you hear.
FFT 4096 and Log scale are a useful starting point for speech, music, hum, and noise.
Look for bands, harmonic spacing, broadband clouds, and short vertical transients.
Use the image to locate a passage, then listen around it before deciding what caused it.
Download the current PNG or CSV. Pro adds the complete timeline and selected 4K export.
Best for reading exact frequency and level at the current moment. Earlier moments disappear unless held or captured.
Best for changing tones, speech, intermittent noise, harmonics, and events that need a timeline.
Best for edits, timing, waveform shape, and obvious clipping. It does not separate frequencies.
FFT size controls the trade-off. A larger transform separates nearby steady frequencies; a smaller transform follows brief changes more closely.
Color is not calibrated sound pressure. Brightness and contrast reveal structure, while the plotted digital level remains dBFS unless the complete signal chain is calibrated.
A pattern is a lead, not a cause. A line near 50 or 60 Hz may suggest mains hum, but fans, engines, music, handling, and room noise can occupy similar frequencies.
Read the complete measurement methodology →Short answers to the decisions that most often change the result.
A spectrogram shows time on the horizontal axis, frequency on the vertical axis, and signal level through color or brightness. It reveals when tones, harmonics, noise, speech, and short events occur.
Yes. Load a supported MP3, WAV, FLAC, M4A, or OGG file, choose Spectrogram, and press Play. The analyzer also prepares complete-file spectrogram data for supported exports and Pro timeline tools.
Yes. Choose microphone input and allow access when prompted. The live view keeps the latest five seconds so changes remain readable while you listen and measure.
FFT 4096 is a balanced starting point. A larger FFT separates nearby frequencies more clearly but spans a longer slice of time; a smaller FFT follows short changes more closely with less frequency detail.
Brighter colors represent stronger energy under the selected display settings. Bright horizontal bands often indicate sustained tones or harmonics, while short vertical marks often indicate clicks, attacks, or other transients.
Open the analyzer, switch to Spectrogram, and follow the signal across time.
Start analyzing