What is an audio spectrum?
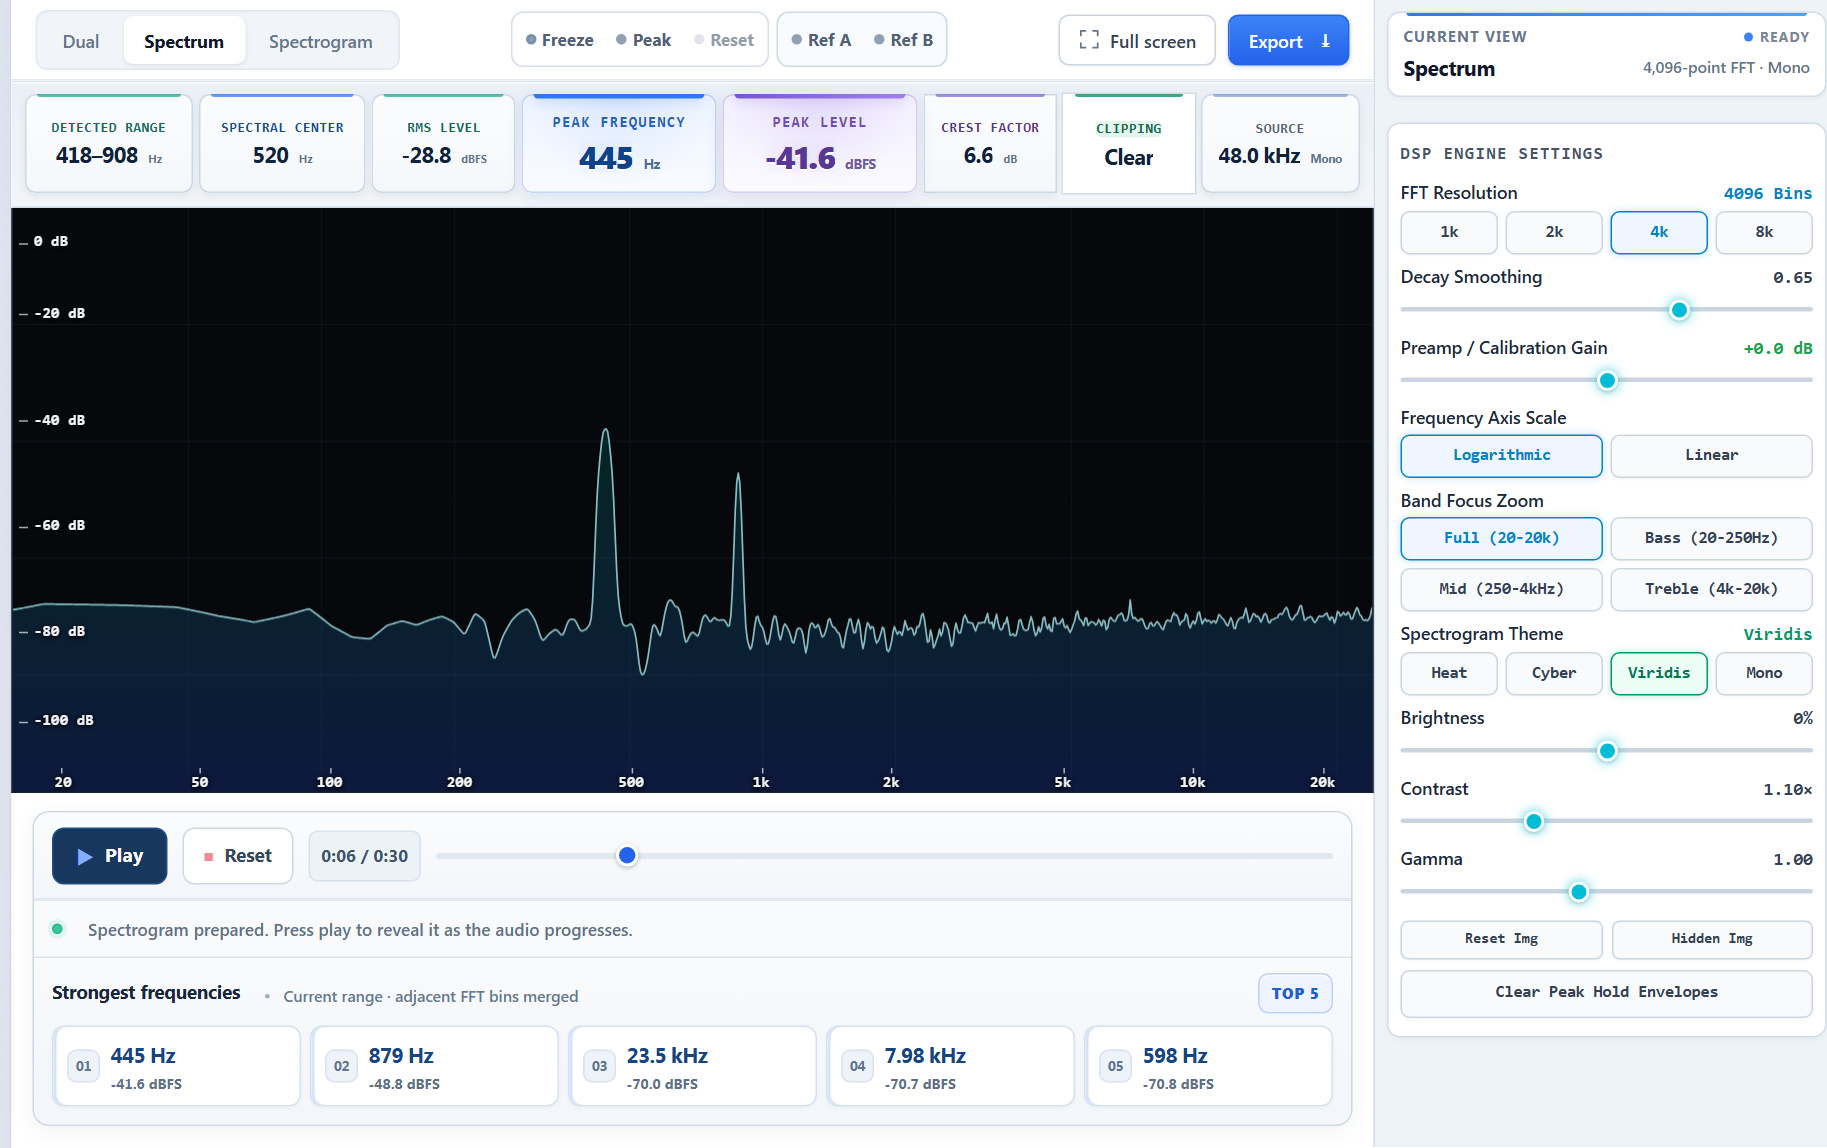
An audio spectrum shows how a signal's energy is distributed across frequency. Low frequencies appear on the left, high frequencies on the right, and the vertical level shows how strong each part of the signal is.
Is my audio uploaded anywhere?
No. Audio decoding, FFT analysis, rendering, and export happen in your browser. The selected file and microphone signal are not sent to an analysis server.
What is the difference between Spectrum and Spectrogram?
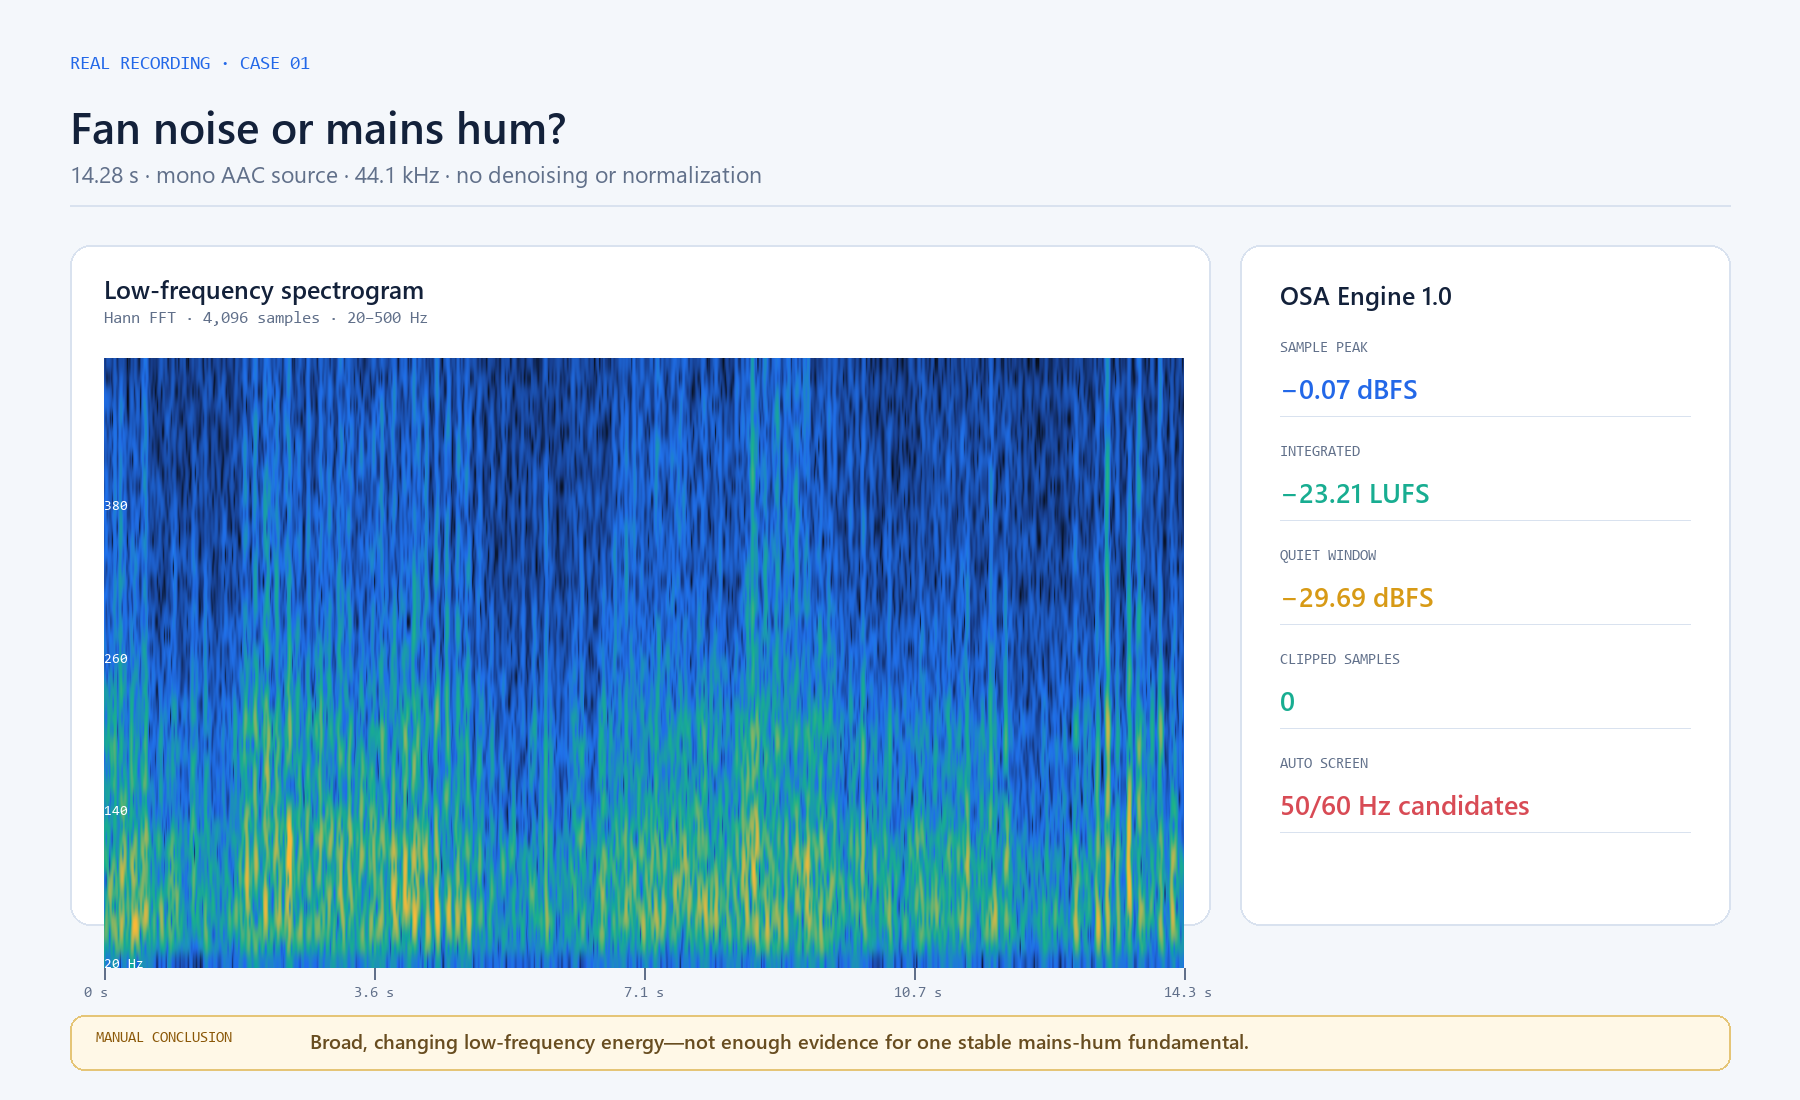
Spectrum shows the frequency content at the current moment. A spectrogram adds time as a horizontal dimension, so you can see how tones, harmonics, speech, noise, and encoded images change throughout a recording.
How do I find the dominant frequency of a sound?
Play a stable part of the signal, then read Peak frequency and the Strongest frequencies list. Use Freeze display or Peak Hold if the peak moves quickly, and check nearby harmonics before treating the strongest peak as the fundamental pitch.
What is the best FFT size?
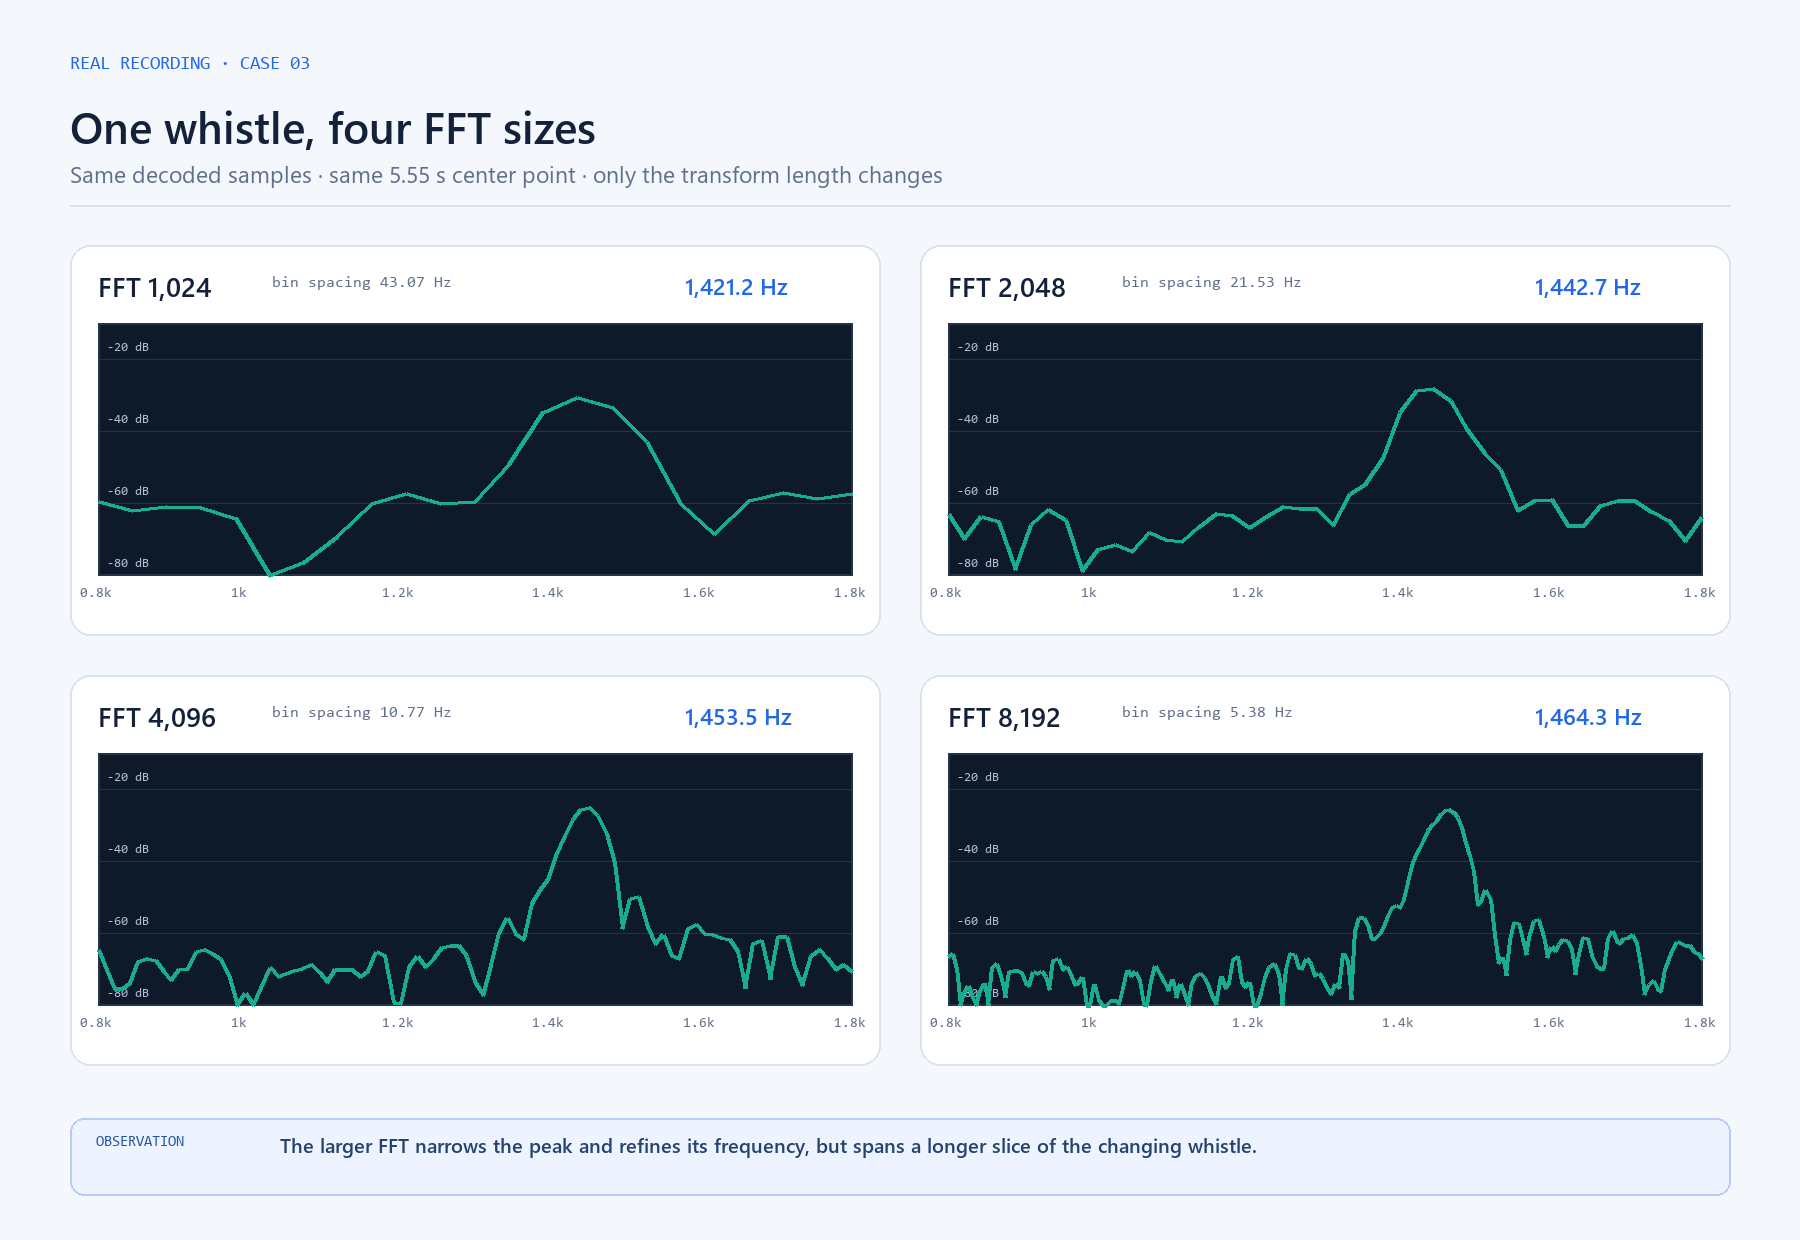
4096 is a balanced default. Larger FFT sizes separate nearby frequencies more clearly but respond more slowly to short events. Smaller values improve time resolution for rapidly changing sounds.
Why do the levels use dBFS instead of sound-pressure dB?
dBFS measures level inside a digital audio signal, where 0 dBFS is the maximum before clipping. A browser cannot provide reliable dB SPL measurements without a calibrated microphone and device-specific correction.
Which audio formats can I analyze?
The tool accepts common browser-supported formats including MP3, WAV, FLAC, M4A, and OGG. Actual decoding support can vary slightly by browser and operating system.
Can I analyze YouTube or audio playing in another browser tab?
The website analyzes uploaded files and microphone input. To inspect audio playing in the current browser tab, use the Chrome Spectrum Analyzer extension; protected browser pages and some streaming sources may restrict capture.
Why does the live Spectrogram show a five-second window?
A focused five-second window keeps changes readable during playback and microphone input. Uploaded files also receive a free low-resolution full-file preview. Pro adds detailed diagnostics, full CSV data, and exact 4K range export.
Can this reveal hidden Spectrogram images?
Yes. Use Reveal hidden image as a starting preset, then adjust brightness, contrast, gamma, frequency scale, and color map. Results depend on how the image was encoded in the source audio.
Can it detect clipping, noise floor, and 50/60 Hz hum?
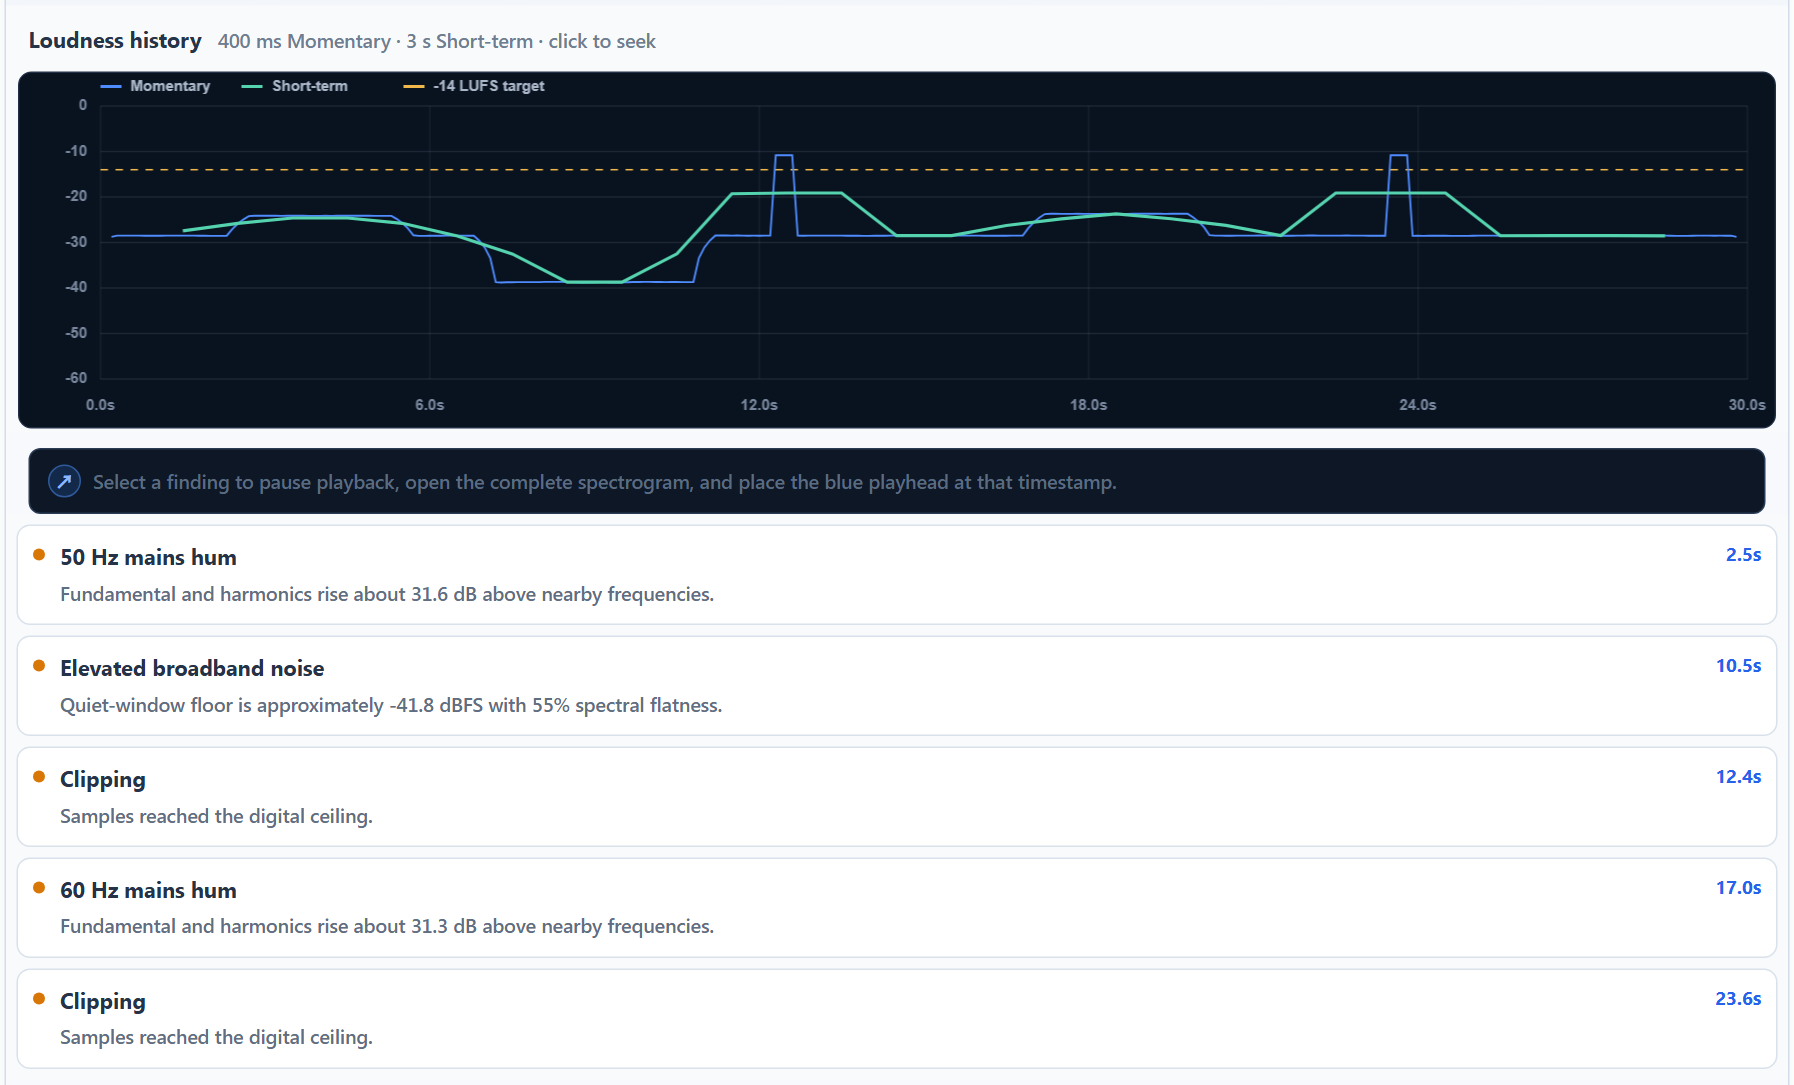
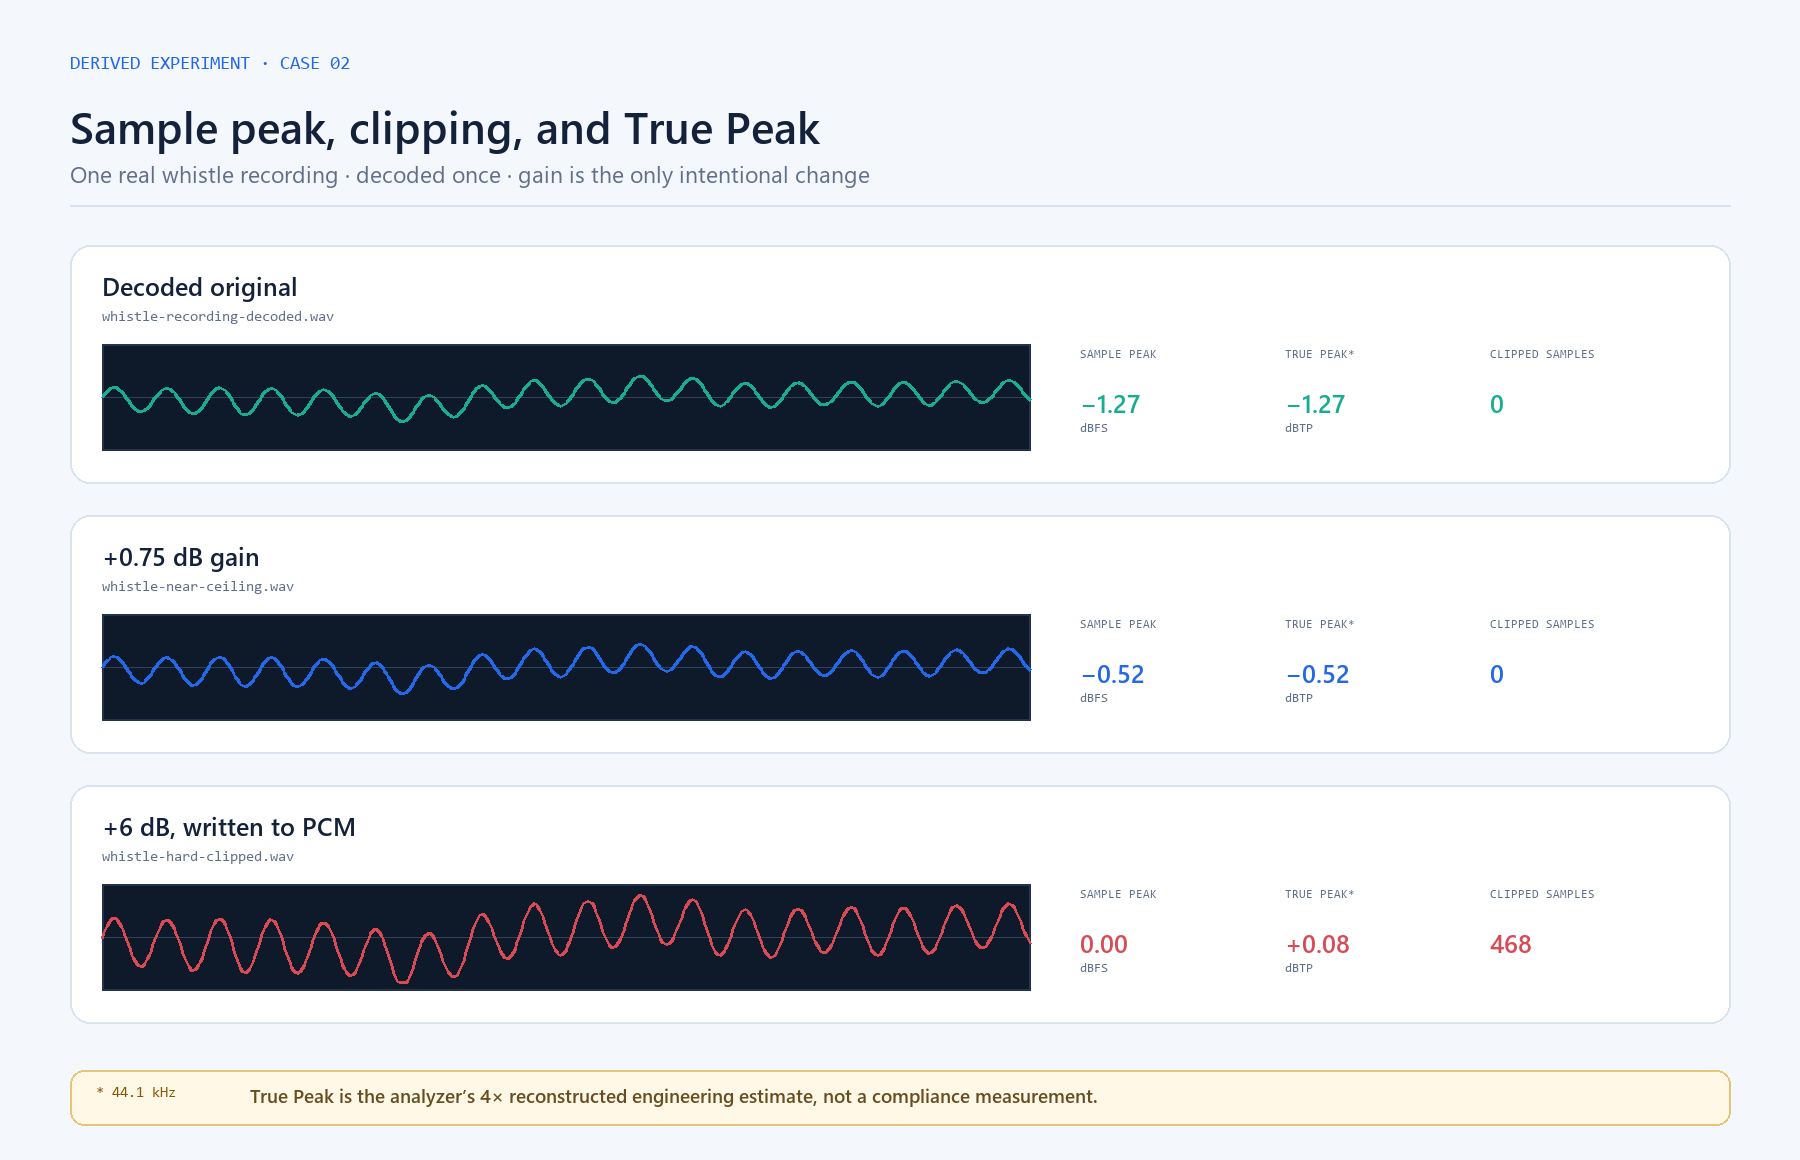
Pro screens the complete file for timestamped clipping, broadband-noise, and mains-hum candidates. Review the clipping detector, noise-floor method, and 50/60 Hz hum detector before interpreting the findings; automatic results are diagnostic leads, not proof of a cause.
How do I compare two recordings, channels, or moments?
Capture A and Capture B hold two current Spectrum curves as color-coded overlays. Keep the FFT size, channel, scale, playback position, and input level consistent, then compare the live signal with either reference instead of relying on visual memory. Analysis presets save settings, not captured curves.
Are Pro loudness and True Peak measurements certified?
No. Pro uses K-weighted gated integrated loudness and a 4× reconstructed True Peak scan for engineering diagnostics. It is not a replacement for a certified broadcast compliance meter.
What can I do with PNG and CSV exports?
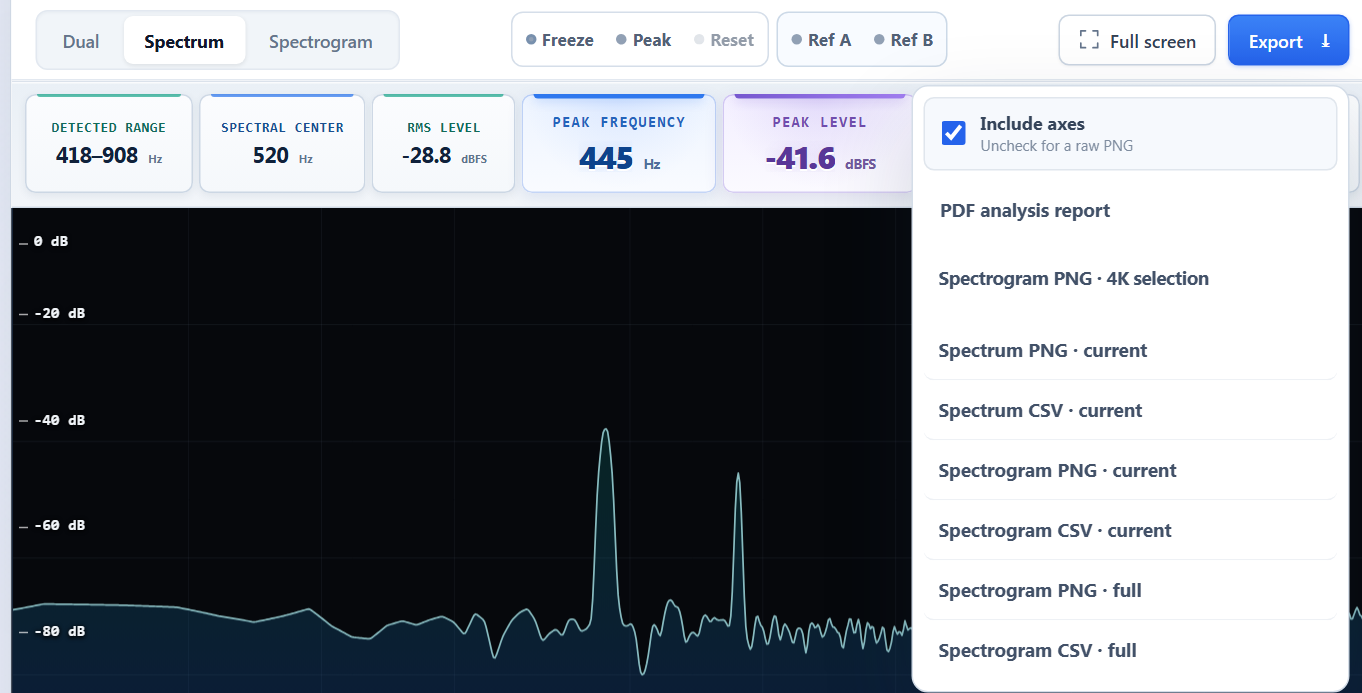
PNG preserves a readable visual result with optional axes, and a standard full-file Spectrogram PNG is free. Spectrum CSV contains frequency and amplitude values for calculation or comparison in Excel, Python, or another plotting tool. Pro adds full-file Spectrogram CSV data, PDF reports, and high-density 4K selections.
How can I generate tones, sweeps, or test noise?
Use the free Tone Generator for a fixed frequency, the Frequency Sweep Generator to move across a range, or the Noise Generator for white, pink, and brown noise. Lower the playback volume before starting a test signal.