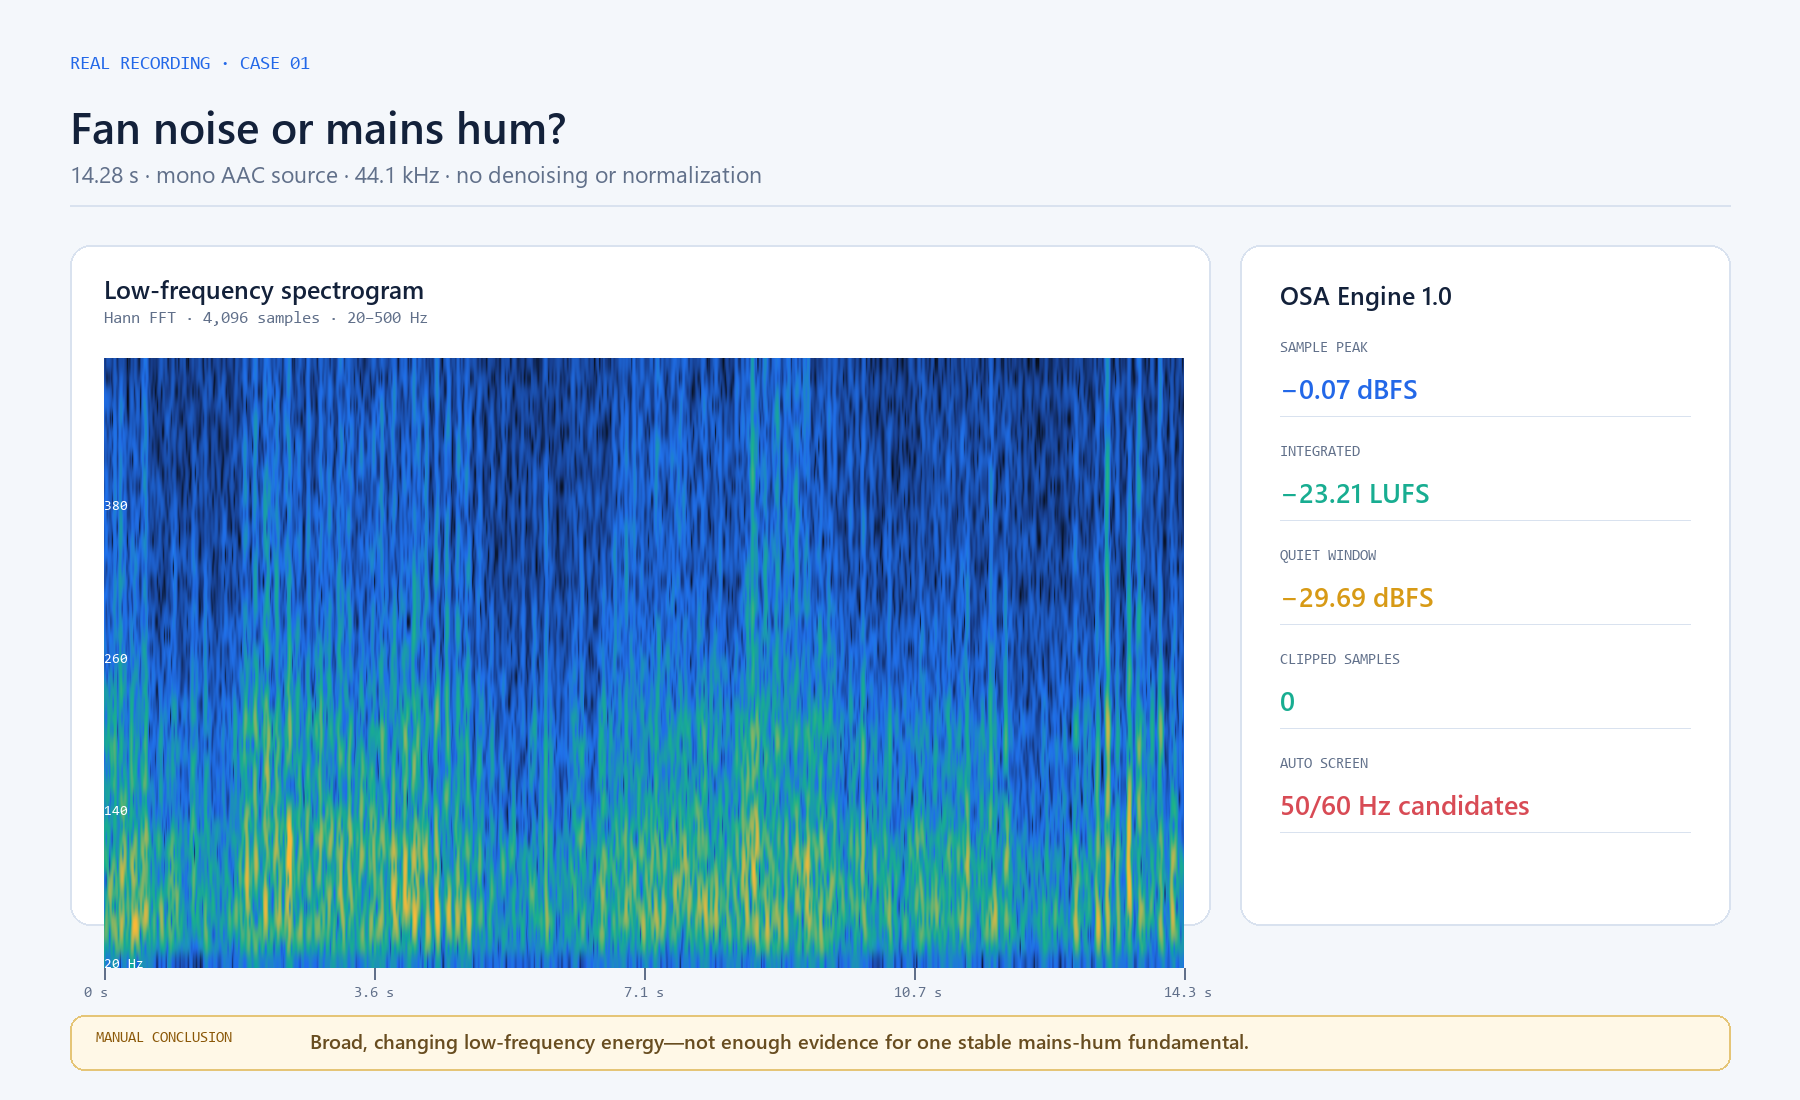
The recording contains strong, changing low-frequency fan noise, but it does not show a stable enough 50 or 60 Hz harmonic pattern to justify a confident mains-hum diagnosis.
The recording and what I did not know
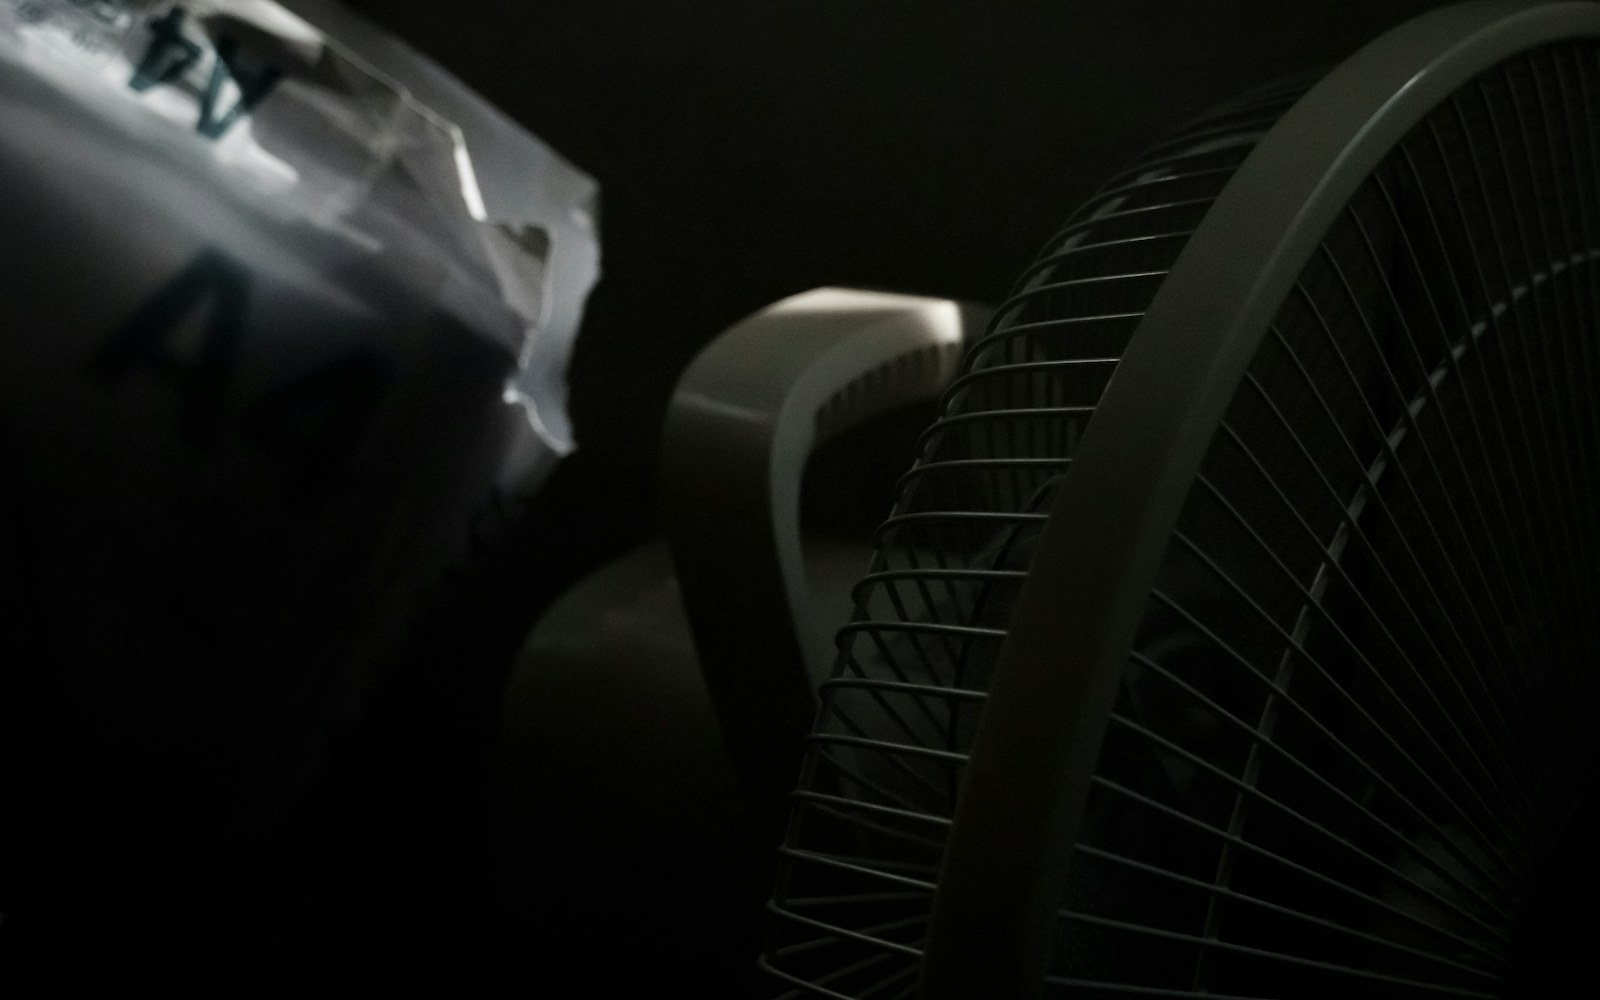
This started with a short phone recording labelled only as an electric fan. I did not have reliable notes for microphone model, distance, fan speed, room dimensions, or phone processing. Rather than invent a controlled setup after the fact, I kept those gaps visible: this is a field sample, not a laboratory measurement.
The supplied file is 14.28 seconds of mono AAC audio in an M4A container at 44.1 kHz. I decoded it once to PCM WAV for repeatable analysis. I did not normalize it, raise the gain, denoise it, or filter the low end. The M4A is the original listening file; the WAV is the decoded analysis copy. Decoding does not restore information already discarded by AAC.
What the analyzer measured
The whole-file pass measured −23.21 LUFS integrated, −20.87 dBFS RMS, and a −0.07 dBFS sample peak. The quietest measured window was still −29.69 dBFS, which fits an almost continuous mechanical source rather than a recording with a clean silent baseline.
The spectrogram is more useful than a single spectrum here. Low-frequency energy changes over the recording, while the average spectrum does not present one clean fundamental with a stable ladder of harmonics.
| Measurement | Result | Interpretation |
|---|---|---|
| Duration | 14.28 s | Short field recording |
| Integrated loudness | −23.21 LUFS | Whole-file gated estimate |
| RMS level | −20.87 dBFS | Average sample-domain energy |
| Sample peak | −0.07 dBFS | Very little sample headroom |
| Quietest window | −29.69 dBFS | No clean silent baseline |
| Clipped samples | 0 | No sample clipping found |
Why I did not label it mains hum
The automatic screening pass raised several 50 and 60 Hz candidates near the start. That is useful as a list of places to inspect, but it is not a verdict. A rotating fan, air movement, room modes, phone high-pass behaviour, and genuine electrical hum can all put energy in the same low-frequency neighbourhood.
I checked the candidates against the full spectrogram and the average low-frequency spectrum. The suspected fundamental was only about 1 dB above its local background in the whole-file view, and the supporting harmonics were not stable enough across time. My conclusion is therefore deliberately narrower: broad, changing low-frequency fan noise is present; stable mains hum is not established by this recording.
How to repeat the check
Use the original M4A if you want to reproduce the browser workflow, or the decoded WAV if you want the exact PCM used for the figures. Small decoder differences should not change the practical conclusion, but they can move the last decimal place of a peak result.
- 01
Load the complete file
Open the original recording and allow the complete timeline to finish before judging any hum candidate.

- 02
Focus the low-frequency analysis
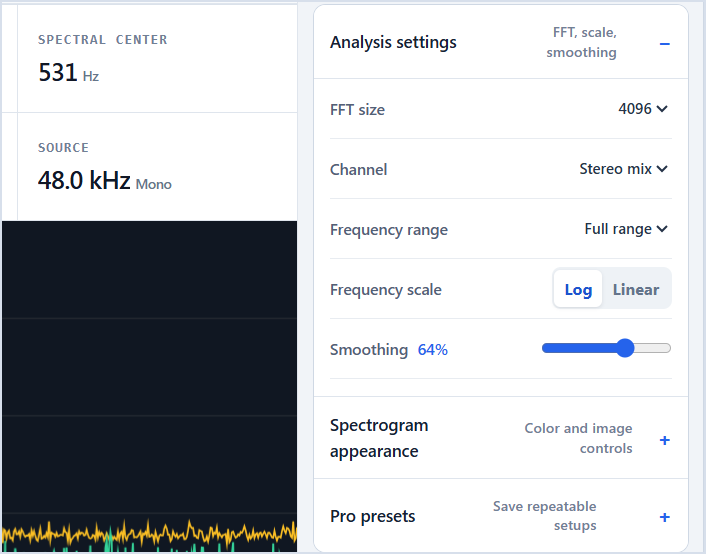
Use a 4096-point FFT and inspect the bass range around 20–250 Hz.
- 03
Compare time around the candidate
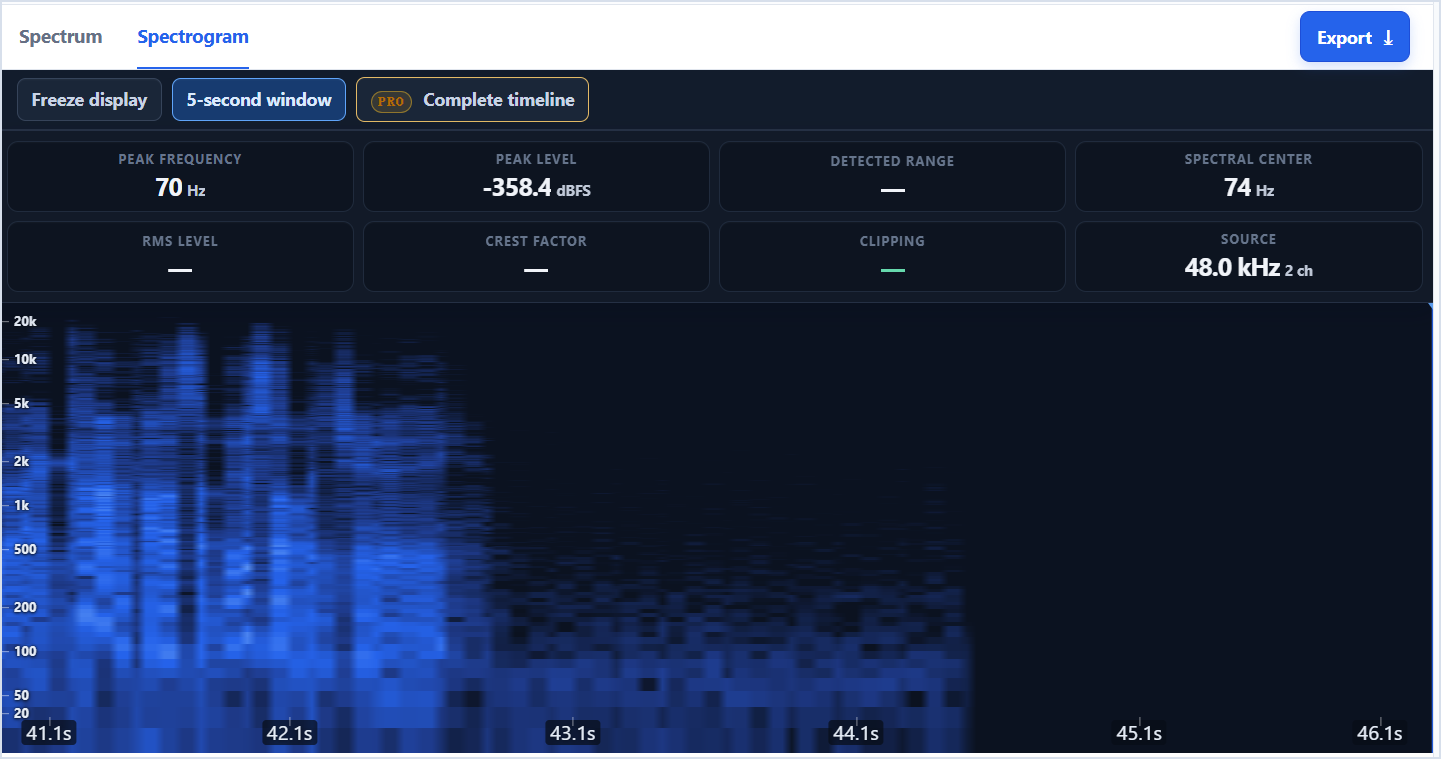
Open the spectrogram and compare the suspected timestamp with the seconds immediately before and after it.
- 04
Check the harmonic evidence
Look for a persistent fundamental plus harmonics at exact multiples, not just one bright low-frequency patch.
- 05
Listen before naming the cause
At a safe level, decide whether the sound behaves like a steady electrical tone, rotating modulation, airflow, or a mixture.
Limits of this result
This recording cannot support calibrated sound-pressure claims. The phone microphone, automatic gain control, AAC encoding, unknown placement, and unknown fan setting all affect the result. A better follow-up would record the same fan at several distances and speeds, add ten seconds with the fan switched off, and capture a second track from a known audio interface.
Loudness and True Peak results at 44.1 kHz are engineering estimates under the analyzer's stated method, not a compliance certificate. The useful result here is comparative and diagnostic: it shows what is in this file and how strong the evidence is for each interpretation.
Common questions
Does a strong 50 Hz bin prove mains hum?
No. A mains-hum diagnosis is stronger when the fundamental persists over time and is supported by harmonics at exact multiples. Mechanical noise and room response can create nearby peaks.
Why provide both M4A and WAV?
The M4A is the original field file. The WAV is a decoded PCM copy used for repeatable analysis; it avoids another lossy encode but cannot recover information removed by AAC.
Could a cleaner recording change the conclusion?
Yes. A longer capture with an explicit fan-off baseline, known placement, and a stable recorder would make electrical and mechanical components easier to separate.
See the frequencies for yourself.
Upload a file, use the microphone, freeze any moment, and export the result.
Analyze audio