Live spectrum
Inspect the current frequency distribution with logarithmic frequency spacing and readable dB markings.
Open a focused side-panel analyzer beside any normal webpage with audible media. Inspect the live spectrum, follow frequency energy over time, and keep the audio on your device.
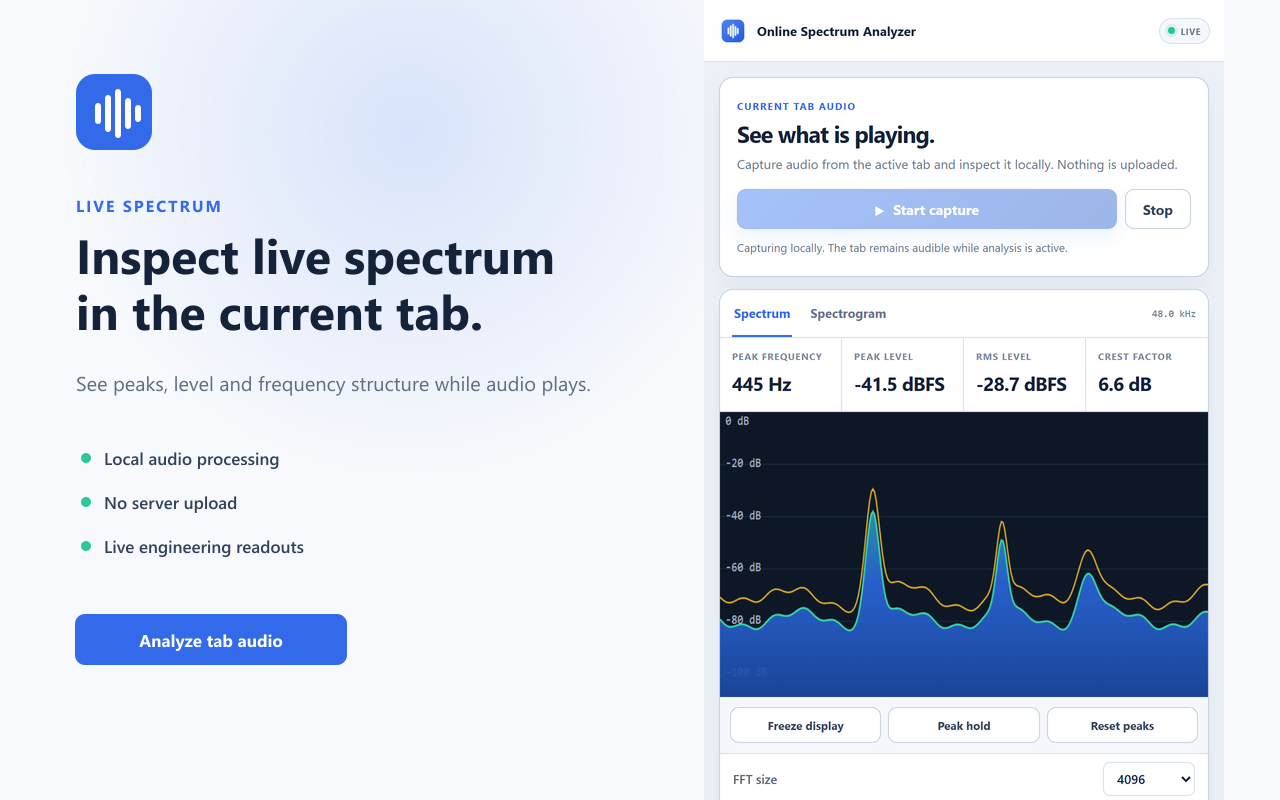
The extension is designed for quick checks while a reference track, video, stream, or other audible webpage continues playing.
Inspect the current frequency distribution with logarithmic frequency spacing and readable dB markings.
Follow changes in frequency energy over time without opening a DAW or uploading the source audio.
Adjust FFT size and smoothing, freeze the display, hold peaks, and reset the peak trace.
Visit a normal Chrome webpage and start playing its audio.
Select the toolbar icon to grant temporary access and open the side panel.
Select Start capture. The tab remains audible while its signal is analyzed locally.
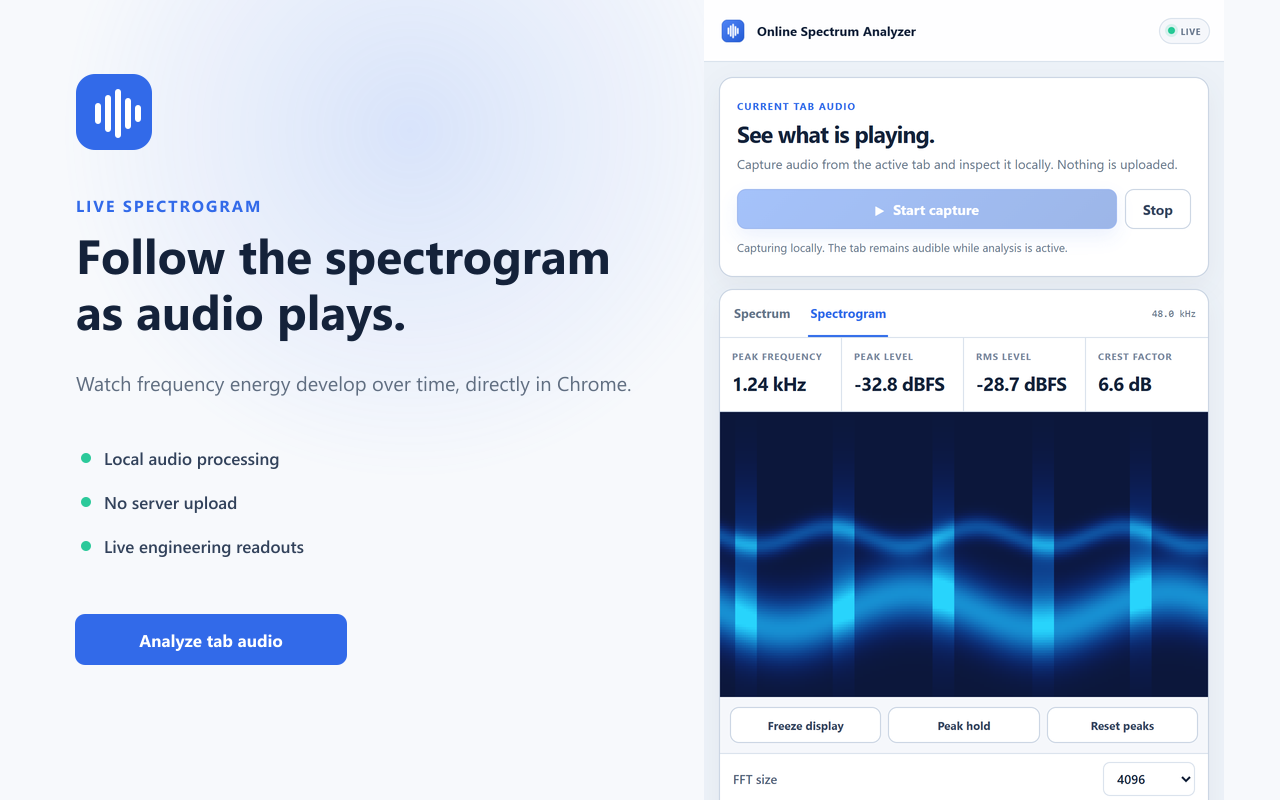
Find the strongest frequency in the current signal.
Watch instantaneous peak energy and average signal level.
Compare peak level with RMS to understand signal dynamics.
See the strongest local frequency peaks without leaving the tab.
The Chrome extension is a fast current-tab monitor. The full website adds uploaded-file and microphone analysis, complete-file diagnostics, timestamped findings, loudness measurements, PDF reports, and high-resolution exports.
Open the full web analyzerLive spectrum, spectrogram, core measurements, peak hold, FFT size, and smoothing.
Deeper inspection, complete-file diagnostics, reports, exports, and optional Pro tools.
Tab audio and derived analysis data are held temporarily in memory and are not uploaded, stored, sold, or used for advertising.