Measure the noise floor with a repeatable silent section, then use its frequency shape to identify the likely source instead of judging one number alone.
What the noise floor represents
The noise floor is the background energy that remains when the sound you want is absent. It can include microphone self-noise, preamp noise, electrical interference, room ambience, computer fans, air conditioning, and quantization or codec artifacts. In a spectrum view it appears as the broad level beneath distinct peaks; in a spectrogram it forms a persistent texture across time.
There is no universal noise-floor value that is good for every recording. A close-miked voice in a quiet room should have a lower floor than a field recording made outdoors. What matters is the distance between the wanted signal and the background, whether the noise is distracting, and whether its shape reveals a fixable problem.
Create a repeatable measurement
Choose a section where the performer or source is silent but the recording chain remains active. Do not mute the track or disconnect the microphone, because that removes parts of the system you are trying to measure. Keep gain, microphone position, channel selection, FFT size, and input device unchanged between comparisons.
Freeze several representative moments instead of relying on a single frame. A saved reference trace makes before-and-after checks clearer when you move a microphone, change gain, turn off a fan, or replace a cable. For live input, allow the display to settle and avoid touching the desk or keyboard during the sample.
- 01
Capture real room silence
Record five to ten seconds with the normal microphone and recording chain active, but without the intended source.

- 02
Lock the comparison settings
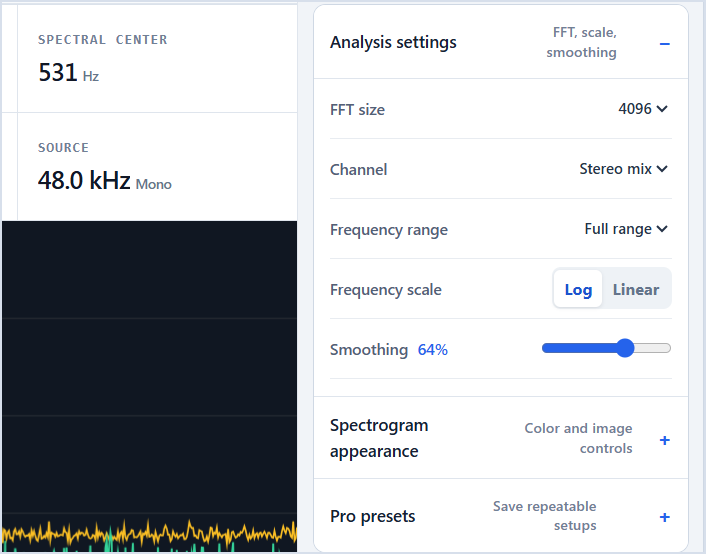
Keep input gain, microphone placement, channel, FFT size, and frequency range unchanged between captures.
- 03
Catch intermittent interference
Use Peak Hold when buzzes, computer activity, or switching noise appears only briefly.

- 04
Compare level and spectral shape
Read the overall change, then inspect whether the noise is broadband, tonal, intermittent, or concentrated at low frequencies.
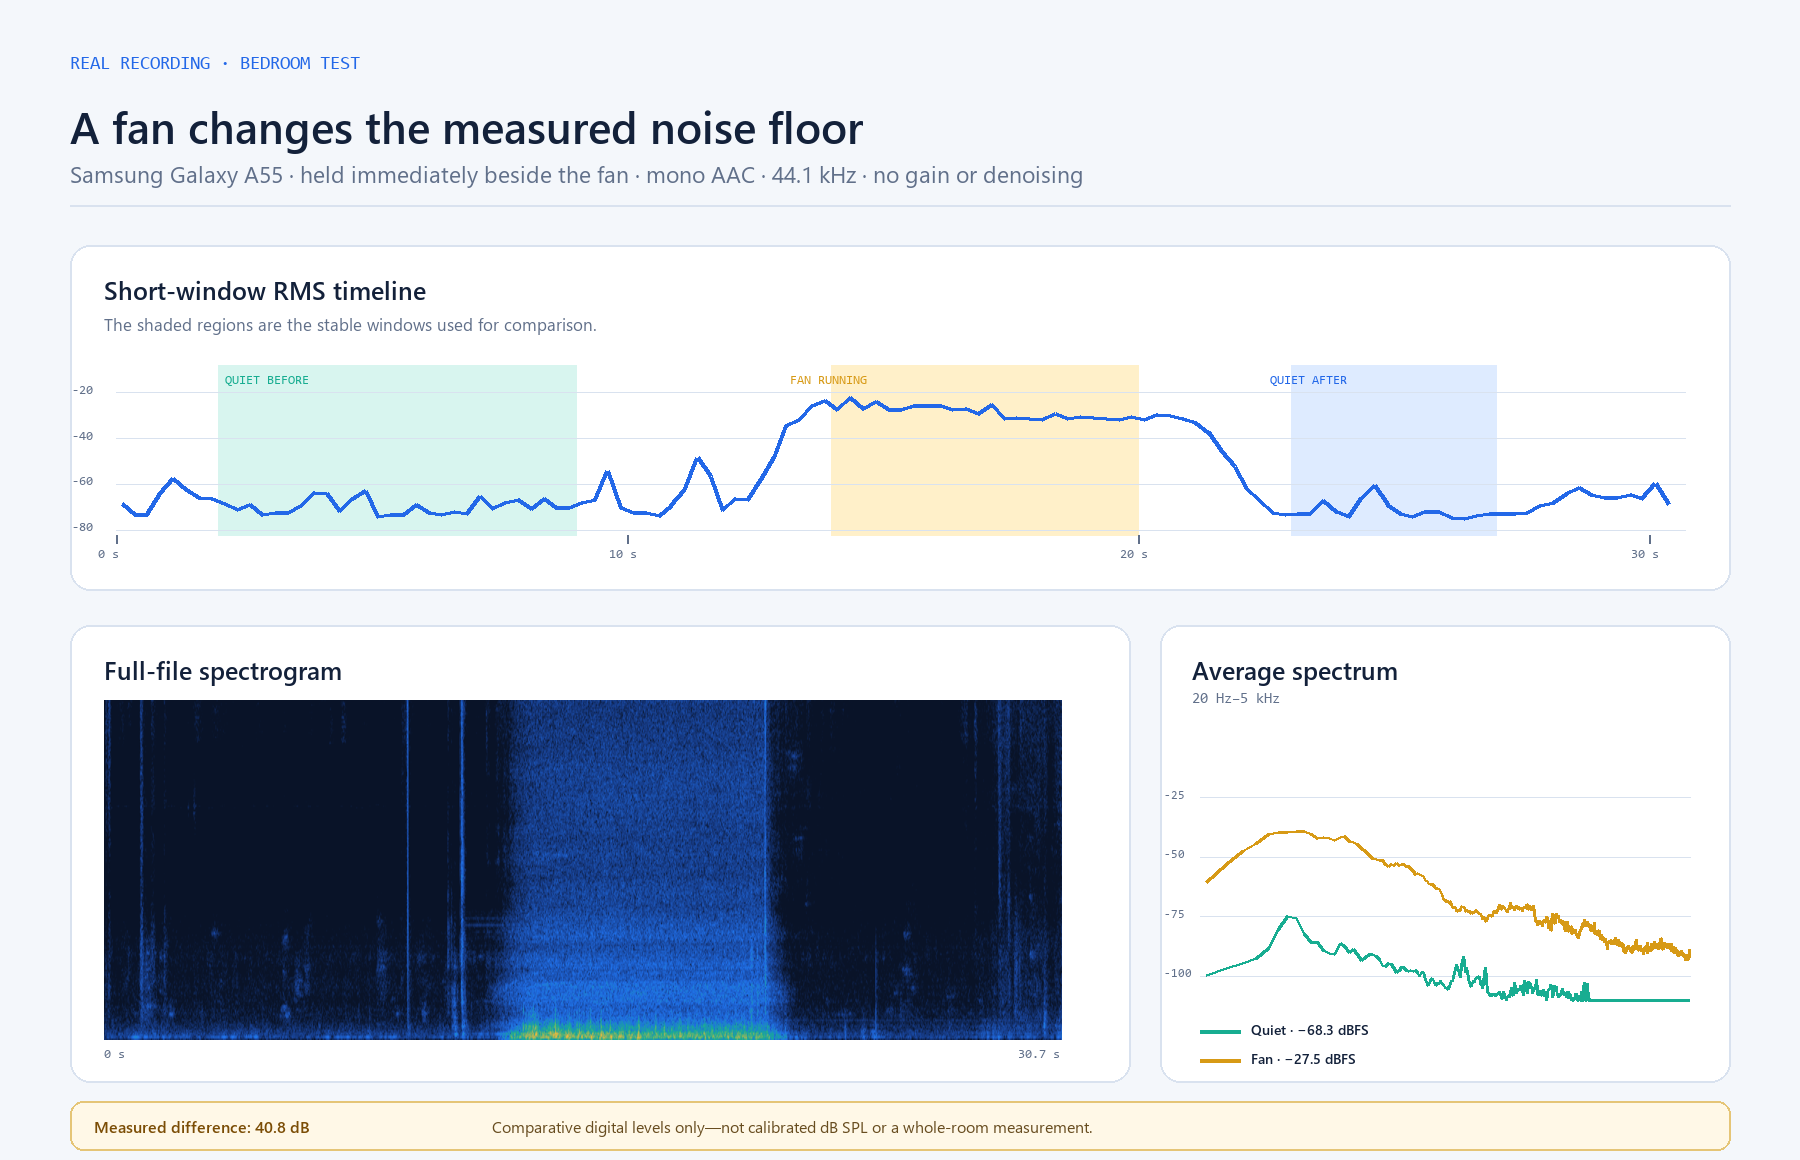
A real bedroom fan test
To put the method into a real file, I recorded a bedroom with a Samsung Galaxy A55 held immediately beside a fan. The 30.70-second recording begins with the fan off, captures the fan starting at about 12.5 seconds, holds a stable running section, and then captures the fan switching off at about 21.5 seconds. The phone stayed in the same position. The supplied mono AAC/M4A file was decoded once to PCM for analysis without gain, normalization, denoising, or filtering.
I compared stable sections rather than including the start and stop transitions. From 2–9 seconds, the fan-off baseline measured −68.3 dBFS RMS. From 14–20 seconds, the running fan measured −27.5 dBFS RMS. After the fan stopped, the 23–27 second section returned to −68.8 dBFS RMS. In this close-range recording, the running section is therefore about 40.8 dB above the baseline in the digital RMS measurement.
| Condition | Window | RMS level | Maximum sample |
|---|---|---|---|
| Quiet before | 2–9 s | −68.3 dBFS | −51.9 dBFS |
| Fan running | 14–20 s | −27.5 dBFS | −11.0 dBFS |
| Quiet after | 23–27 s | −68.8 dBFS | −45.7 dBFS |
Identify noise by its shape
Broad high-frequency energy usually sounds like hiss and often comes from electronics, microphone self-noise, or aggressive gain. A narrow peak at the local mains frequency—50 or 60 Hz—with related harmonics points toward hum, grounding, or electromagnetic coupling. Low irregular energy may be traffic, handling, wind, or heating and ventilation systems.
A spectrogram adds timing information. Continuous horizontal lines indicate stable interference, while repeated vertical marks can reveal switching devices, edits, clicks, or periodic mechanical sounds. Codec noise often follows the program material or appears near the upper frequency limit rather than remaining perfectly constant.
Reduce the cause before processing
Start with physical and electrical fixes: move the microphone closer to the source, reduce unnecessary gain, turn off nearby noise sources, separate audio cables from power adapters, and test one connection at a time. These changes improve the signal before any software has to guess what should be removed.
Noise reduction, gates, and filters can help, but strong settings may damage consonants, ambience, cymbals, or musical decay. Capture a reference, make one change, and compare the same passage. The goal is not an empty-looking analyzer; it is a cleaner recording without audible artifacts.
Common questions
What is a good noise floor for audio?
It depends on the source and recording conditions. Judge the noise relative to the wanted signal and the listening context rather than treating one dBFS value as a universal target.
Why do I see a 50 Hz or 60 Hz peak?
It often indicates mains-related hum or electromagnetic interference. Check grounding, cable routing, power supplies, and nearby electrical equipment, then look for harmonics at multiples of the base frequency.
Can I measure noise with the microphone disconnected?
That measures only part of the chain. For a practical recording-floor measurement, leave the normal microphone, gain, and room setup active and analyze a genuinely quiet section.
See the frequencies for yourself.
Upload a file, use the microphone, freeze any moment, and export the result.
Analyze audio