A signal can sit close to 0 dBFS without clipping; in this experiment only the deliberately overdriven copy produced clipped samples and a positive reconstructed True Peak estimate.
One recording, three controlled versions
The source is a 12.98-second phone recording of a person whistling. It arrived as mono AAC in an M4A container at 44.1 kHz. I decoded it once to PCM, then made two deliberately simple variants: one raised by 0.75 dB, and one raised by 6 dB and written to 16-bit PCM so peaks above full scale were hard-clipped.
This is not presented as three independent recordings. The second and third files are controlled derivatives of the same performance, which makes the peak comparison easier to interpret. No limiter, compressor, denoiser, EQ, or normalization was used.
The measured difference
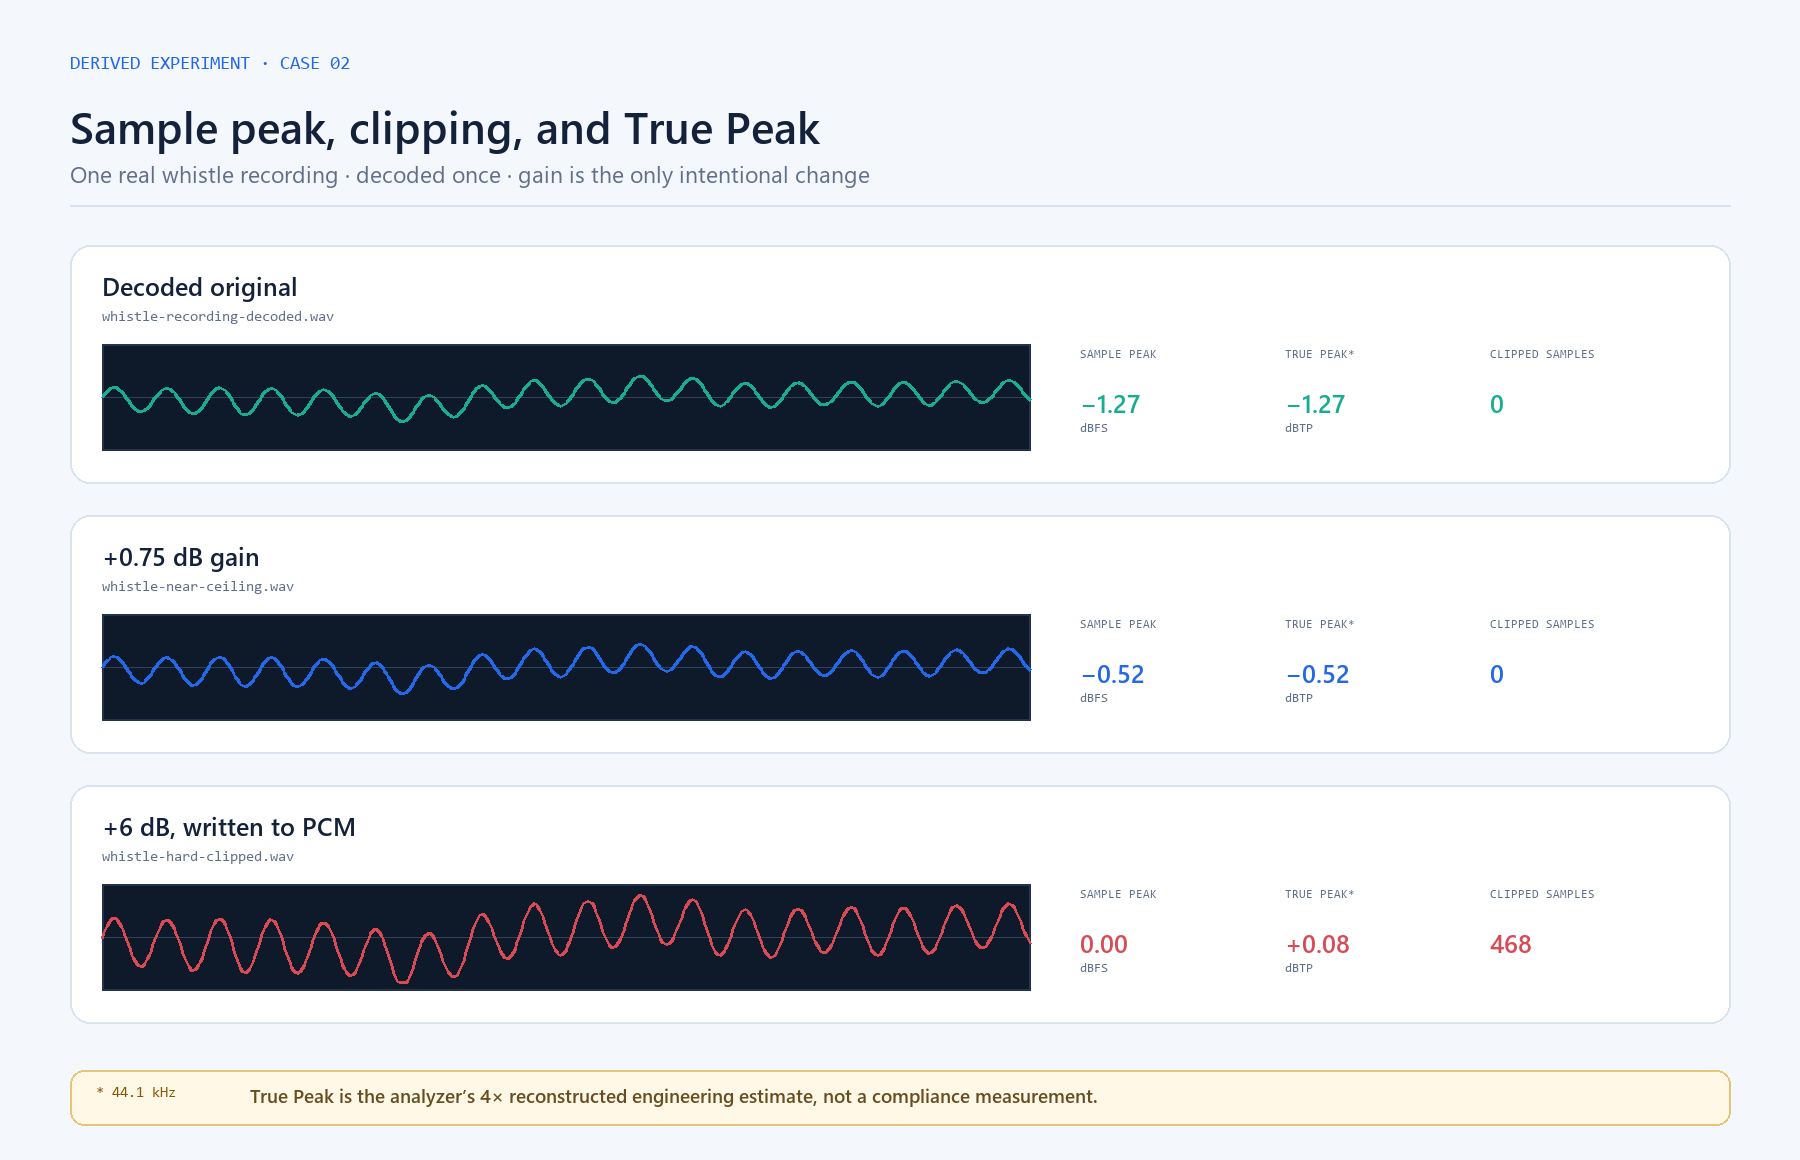
The original peaks at −1.27 dBFS. Raising it by 0.75 dB moves the peak to −0.52 dBFS, but still creates no clipped samples. The +6 dB copy reaches 0.00 dBFS, contains 468 clipped samples, and groups those samples into six separated events.
In this particular source the reconstructed True Peak estimate is effectively the same as sample peak for the first two files. That is a valid result—not every signal produces a large inter-sample overshoot. The hard-clipped copy reaches +0.08 dBTP in the current estimate because reconstruction between its flattened samples can rise slightly above digital full scale.
| Version | Sample peak | True Peak | Clipped samples | Timestamp groups |
|---|---|---|---|---|
| Decoded original | −1.27 dBFS | −1.27 dBTP | 0 | None |
| Near ceiling (+0.75 dB) | −0.52 dBFS | −0.52 dBTP | 0 | None |
| Hard clipped (+6 dB) | 0.00 dBFS | +0.08 dBTP | 468 | 5.23, 5.57, 6.07, 9.78, 10.13, 10.90 s |
What each number actually tells us
Sample peak answers whether a stored sample reaches digital full scale. True Peak estimates what the reconstructed waveform may do between samples. A clipping detector looks for samples at or extremely near the ceiling, then groups neighbouring samples into useful events. These are related checks, but they do not answer the same question.
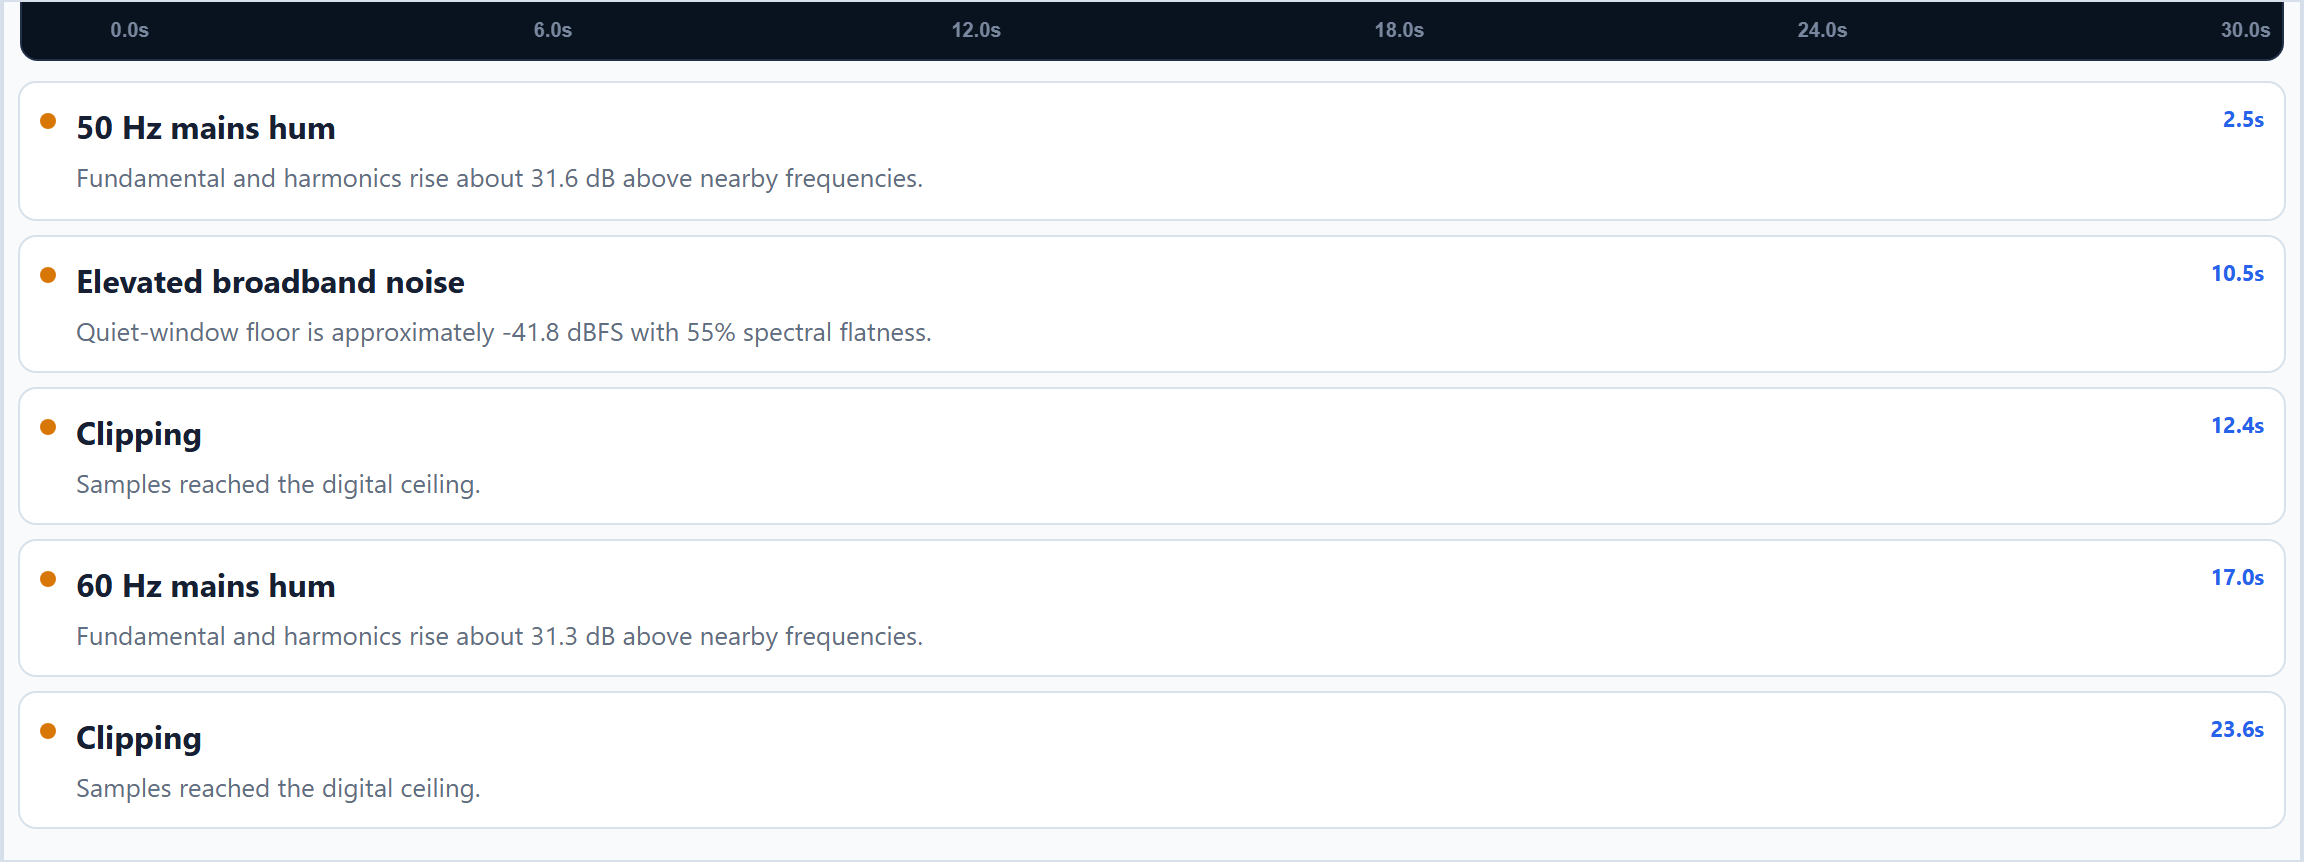
The timestamp list is operationally useful: clicking 5.23 seconds should take an editor to the first affected passage rather than forcing a search through the entire file. The count of 468 samples is evidence of clipping severity, while the six time groups describe where the damage occurs.
How to repeat the experiment
Keep the same decoder and analysis settings for all three files. Compare the files at matched monitor loudness if you are judging sound quality; louder playback alone can make the gained versions seem subjectively better.
- 01
Measure the decoded original
Load the decoded source and record its sample peak, reconstructed True Peak, and clipping count.

- 02
Repeat with the near-ceiling copy
Analyze the +0.75 dB version with unchanged settings and verify that headroom falls without producing a clipping event.
- 03
Open the deliberately clipped copy
Load the +6 dB hard-clipped file and open its timestamped findings.
- 04
Verify each marked event
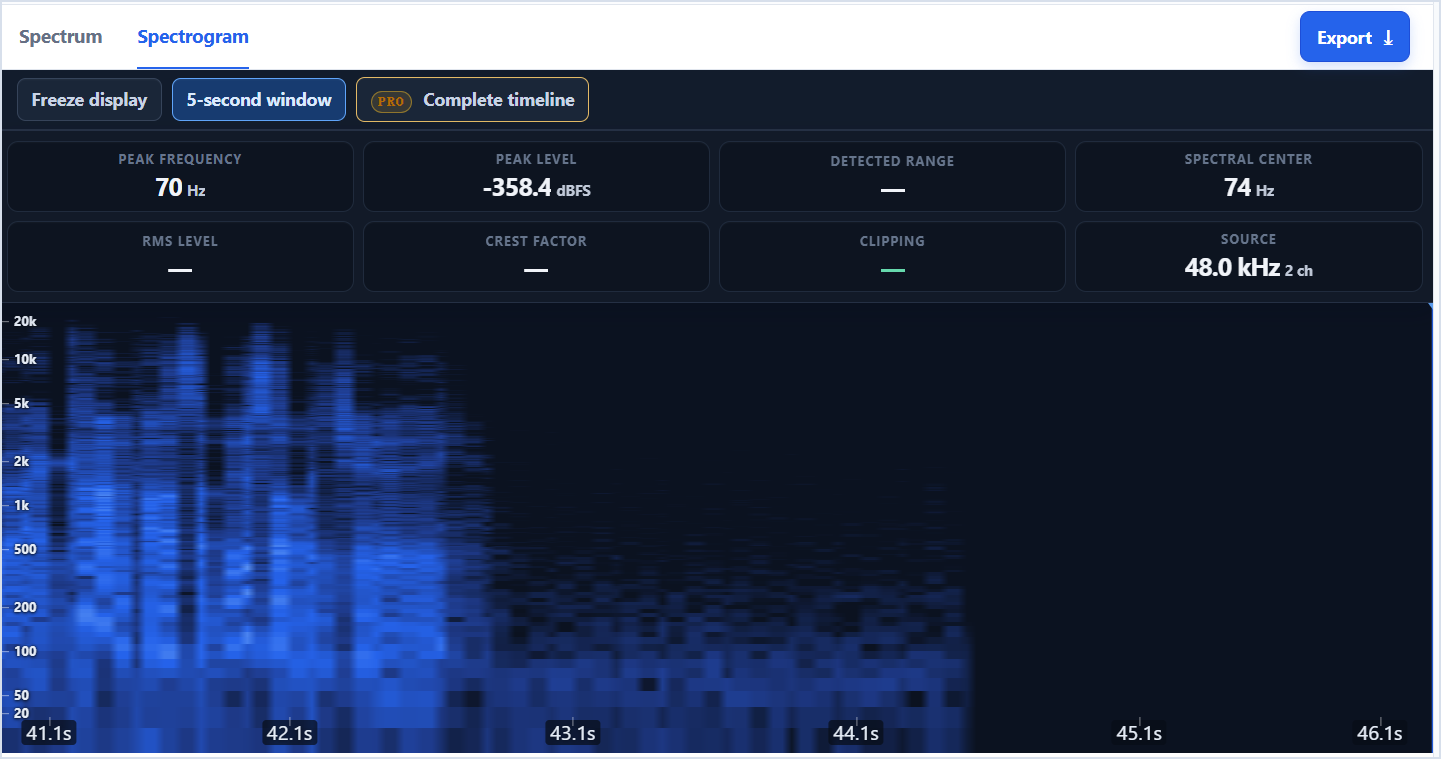
Click a finding, listen around its marker, and inspect the corresponding spectrogram passage instead of trusting the label alone.
- 05
Export only after review
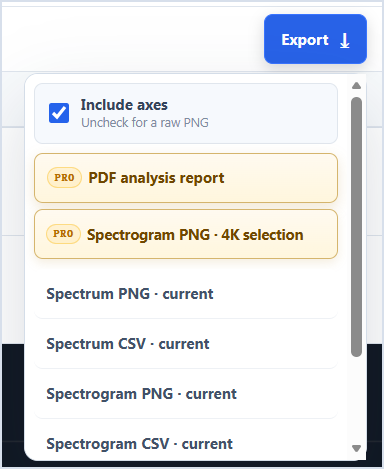
Confirm the source identity and selected assessment profile, then export the report and supporting data.
Method limits
The source was recorded at 44.1 kHz and is not a standardized conformance stimulus. True Peak is therefore reported as the analyzer's reconstructed engineering estimate, not as certified broadcast-meter performance. AAC decoding and the phone's original processing are part of the source history.
Hard clipping is easy to demonstrate, but audible damage depends on duration, repetition, programme content, and playback level. A zero clipped-sample count also does not guarantee that clipping never occurred earlier in an analogue stage or during a previous encode.
Common questions
Is −0.52 dBFS automatically safe?
It avoids sample clipping in this file, but delivery safety also depends on reconstructed True Peak, subsequent encoding, and the destination specification.
Why can True Peak be above 0 dBTP after clipping?
A reconstruction filter can produce a peak between stored samples even when those samples have been clipped to the digital ceiling.
Does no detected clipping prove a clean recording chain?
No. Distortion may have happened in an analogue stage or earlier file and then been recorded below 0 dBFS. The detector only describes the samples it receives.
See the frequencies for yourself.
Upload a file, use the microphone, freeze any moment, and export the result.
Analyze audio