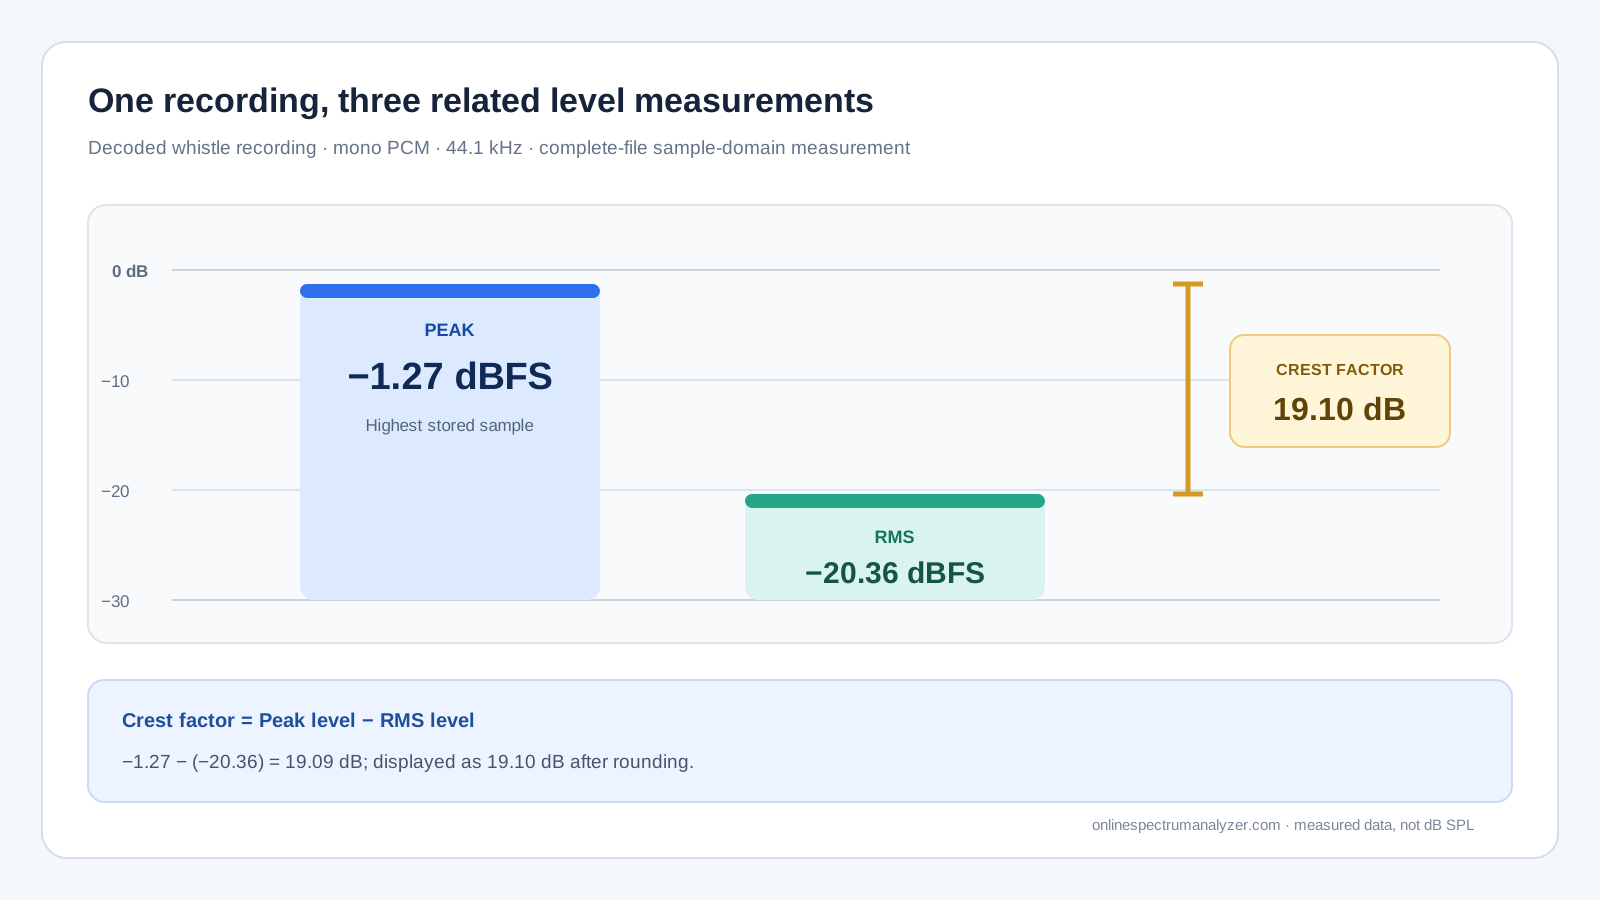
Peak shows headroom, RMS approximates average signal energy, and crest factor describes the distance between them.
Why digital levels are below zero
dBFS means decibels relative to full scale. Zero dBFS is the maximum digital sample level, so ordinary readings are negative. A peak at −6 dBFS has more headroom than a peak at −1 dBFS. Unlike acoustic dB SPL, dBFS does not tell you how loud the sound is in a room.
Frequency-spectrum levels are also shown in dBFS, but a single FFT bin does not equal the total level of the signal. Windowing, FFT size, and how energy spreads across bins influence the height of individual spectral peaks.
One real recording, measured three ways
For a concrete comparison, I used the same decoded whistle recording as the clipping experiment elsewhere in this guide library. Across the complete mono PCM file, its highest stored sample is −1.27 dBFS and its RMS level is −20.36 dBFS. The difference is 19.09 dB, displayed as a 19.10 dB crest factor after rounding.
These values describe this digital file, not acoustic loudness in the room. The relatively large gap says that the whistle recording contains peaks well above its average sample energy; it does not by itself say whether the performance is well mastered, comfortably loud, or suitable for a particular destination.
| Metric | Measured value | What it describes |
|---|---|---|
| Peak level | −1.27 dBFS | Highest stored sample magnitude |
| RMS level | −20.36 dBFS | Average sample-domain energy |
| Crest factor | 19.10 dB | Peak-to-RMS difference after rounding |
Peak level protects against clipping
Peak level tracks the highest instantaneous sample magnitude in the measurement frame. When samples reach or exceed the digital limit, clipping can flatten the waveform and generate new harmonics that were not in the original sound.
A clear clipping indicator is useful, but the absence of current clipping does not prove a complete file never clipped. Inspect the relevant section, use peak hold where appropriate, and remember that clipping may already be baked into a recording at a lower playback level.
RMS describes average energy
RMS—root mean square—summarizes signal energy across a time window. It responds less dramatically to one-sample spikes than peak level and gives a useful view of sustained level. It still is not the same as perceived loudness, which depends on frequency sensitivity, time integration, and standards-based weighting.
Compare RMS only when the measurement window and signal conditions are consistent. A short percussive hit and a sustained tone can have the same peak but very different RMS values.
Crest factor connects peak and RMS
Crest factor is the difference between peak and RMS level in decibels. A large crest factor suggests pronounced transients relative to the average energy. A small crest factor suggests a denser or more compressed signal, though distortion and limiting are not the only possible causes.
Read the three metrics together. Peak reveals remaining headroom, RMS describes sustained energy, and crest factor describes dynamics. Then inspect the spectrum and spectrogram to learn where and when that energy occurs.
Common questions
Is −3 dBFS twice as quiet as 0 dBFS?
No. Decibels are logarithmic, and perceived loudness is more complex. A 3 dB change represents roughly double or half the signal power, not a simple halving of perceived loudness.
What crest factor is good?
There is no universal target. Speech, percussion, classical music, mastered pop, and test tones naturally have different crest factors.
Can audio clip below 0 dBFS?
Stored samples below 0 dBFS are not sample-clipped at that point, but earlier clipping can remain in the recording, and reconstruction between samples can create inter-sample peaks in some playback chains.
See the frequencies for yourself.
Upload a file, use the microphone, freeze any moment, and export the result.
Analyze audio