
Use a linear frequency scale, higher FFT size, and controlled contrast changes—then confirm that the pattern survives multiple settings.
Why audio can contain pictures
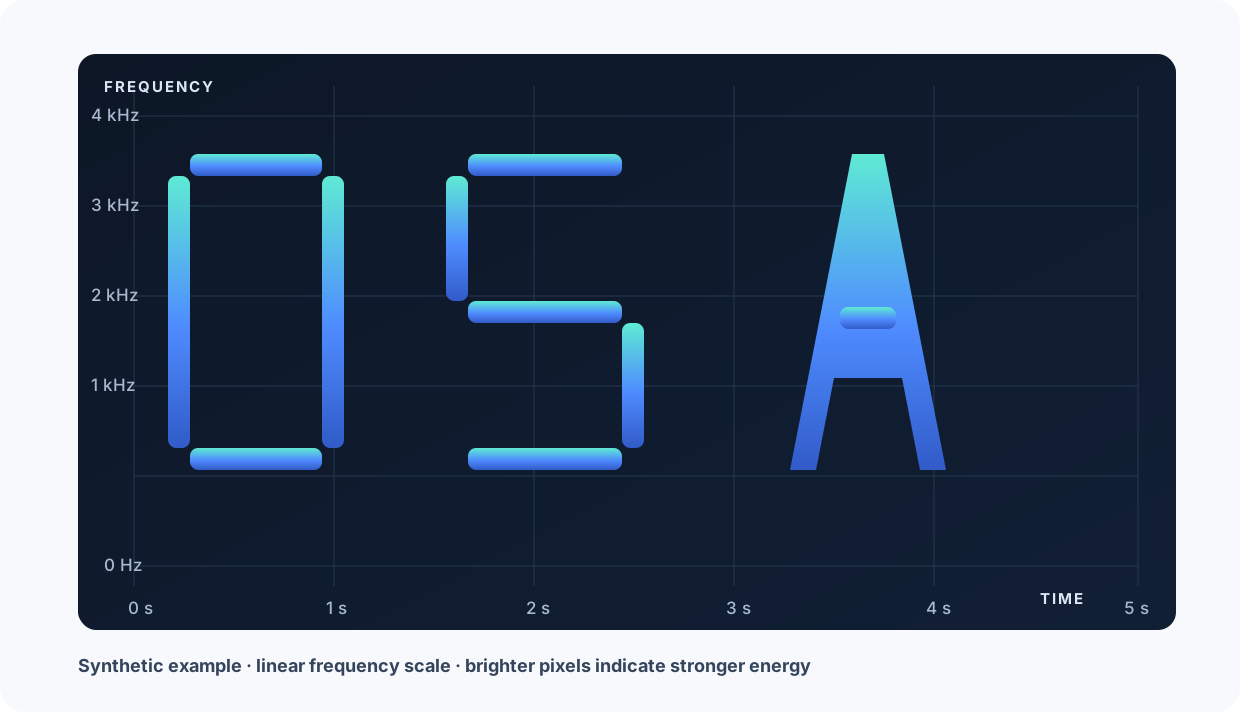
A spectrogram maps time and frequency onto two visible dimensions. A creator can synthesize tones so that their energy traces letters, symbols, or an image when displayed. This technique appears in experimental music, game easter eggs, alternate reality games, puzzles, and spectrogram art.
Not every face-like or letter-like shape is intentional. Compression blocks, harmonics, stereo effects, and random noise can create suggestive patterns. Treat the first sighting as a clue, not proof.
Use settings that preserve geometry
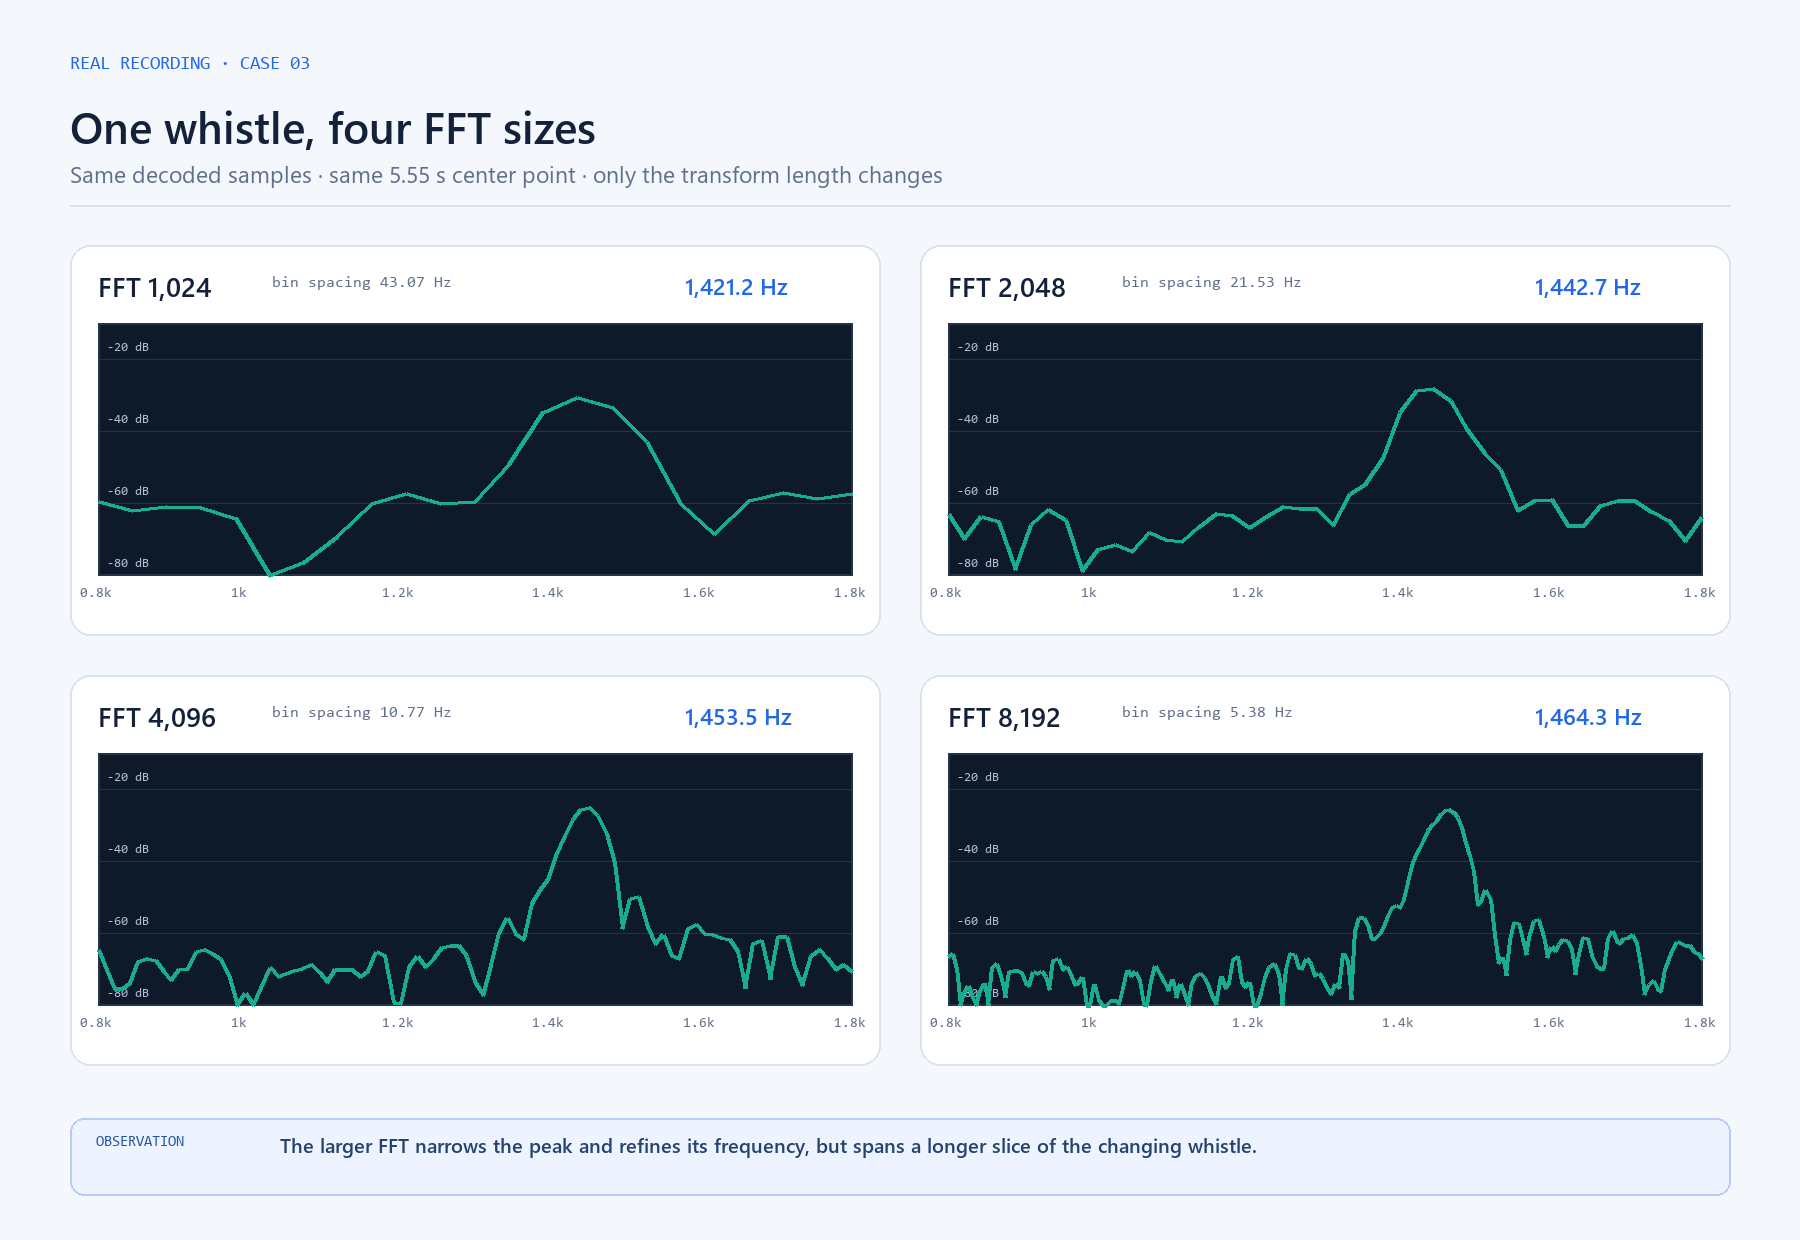
Start with a linear frequency scale. Equal vertical distances then represent equal frequency differences, which is how many spectrogram images are designed. Try FFT 4096, then 8192 if edges look soft or narrow lines merge.
Switch to a monochrome or high-contrast color map. Increase contrast slowly and adjust brightness until the background recedes without erasing faint edges. The Reveal Hidden Image preset is a fast starting point, but manual refinement is often necessary.
- 01
Switch to a linear frequency scale
Use equal vertical spacing for equal frequency differences so encoded geometry is not warped by a logarithmic axis.

- 02
Increase frequency resolution
Begin with FFT 4096 and compare 8192 when narrow edges or nearby lines remain merged.
- 03
Keep smoothing low
Reduce smoothing so edges remain crisp and short encoded details are not blended into their neighbors.

- 04
Tune the color map carefully
Use monochrome or a high-contrast map, then change brightness and contrast gradually until the background recedes.
Search the full recording methodically
Watch the moving five-second window during playback and note suspicious times. Encoded content may be very short, placed near silence, or concentrated above the range emphasized by normal listening. A full spectrogram export makes it easier to scan the complete file before returning to a close window.
Check left, right, and mixed channels when available. Some puzzles hide content in one channel or rely on differences between them. Avoid repeatedly transcoding the file because lossy compression can blur thin lines.
Verify before decoding
A real encoded image should remain recognizable across modest changes in FFT size, brightness, and color map. Look for deliberate alignment, repeated stroke thickness, or structure that matches the timing of the audio. Compare against nearby sections that contain similar noise.
Export the current PNG for close inspection and CSV when you need the underlying time-frequency values. Preserve the original audio and record your settings so another person can reproduce the result.
Common questions
Which color map is best for hidden images?
Monochrome is often easiest for edges and text, but the best map is the one that separates the encoded level from the background without clipping faint detail.
Why is the image stretched?
A logarithmic frequency axis, display aspect ratio, or different FFT settings can distort geometry. Start with a linear scale and compare exports.
Can MP3 files contain spectrogram images?
Yes, but lossy compression may weaken fine high-frequency details. A lossless source such as WAV or FLAC is preferable when available.
See the frequencies for yourself.
Upload a file, use the microphone, freeze any moment, and export the result.
Analyze audio