Use Spectrum for an exact frequency snapshot; use Spectrogram when timing, motion, or structure across a recording matters.
The difference in one sentence
A spectrum shows level by frequency for one short moment. A spectrogram shows frequency by time, with level encoded as color. Both usually come from the same FFT process, but they organize the results around different questions.
If you are asking ‘what frequencies are strongest right now?’, choose Spectrum. If you are asking ‘when did this frequency appear, disappear, or move?’, choose Spectrogram.
When Spectrum is the better tool
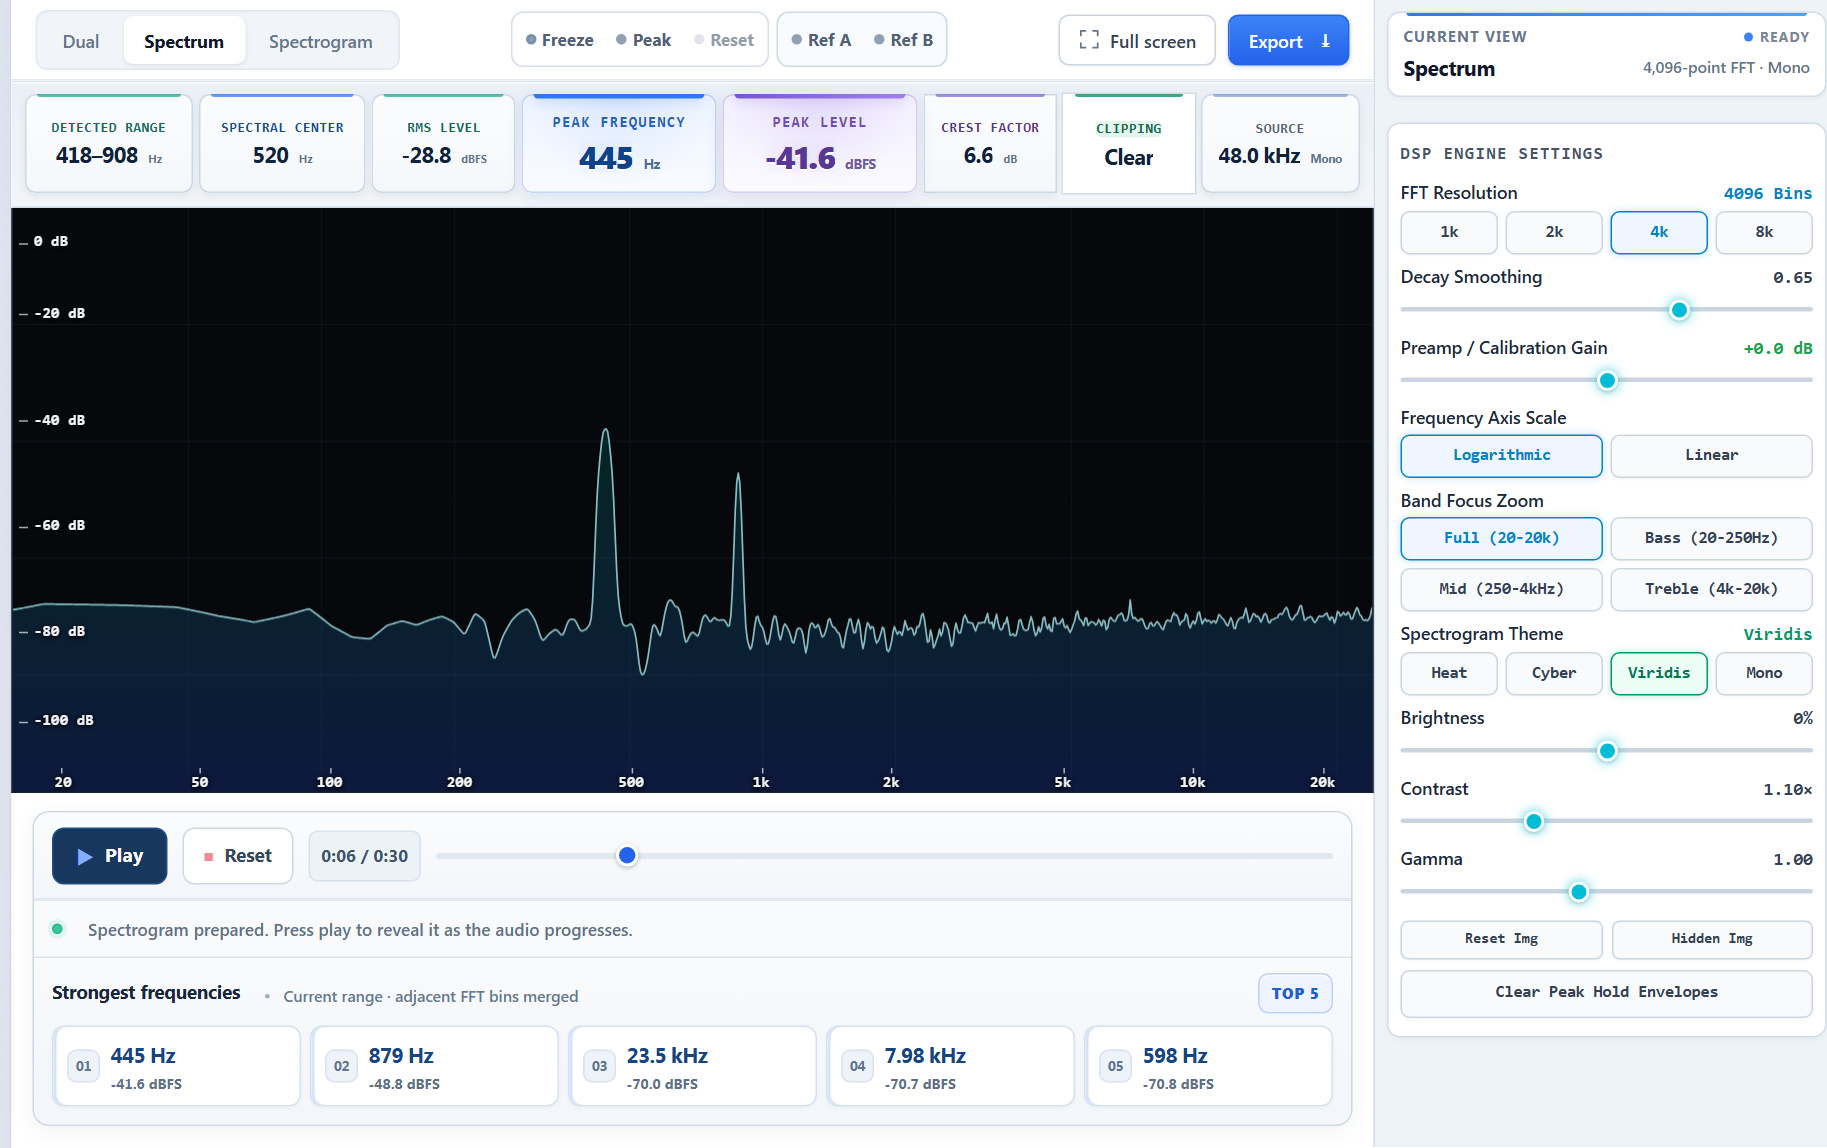
Spectrum gives room for precise frequency and dB readings. It is ideal for locating a hum, checking a tuning frequency, comparing harmonics, inspecting a noise floor, or seeing how an EQ adjustment changes a band.
Peak Hold captures brief maxima, while a saved reference makes before-and-after comparison clearer. Freeze the view at a representative moment rather than trying to read a rapidly moving trace.
- Finding a dominant frequency
- Measuring harmonic spacing
- Comparing levels by band
- Checking hum, whine, or resonance
When Spectrogram is the better tool
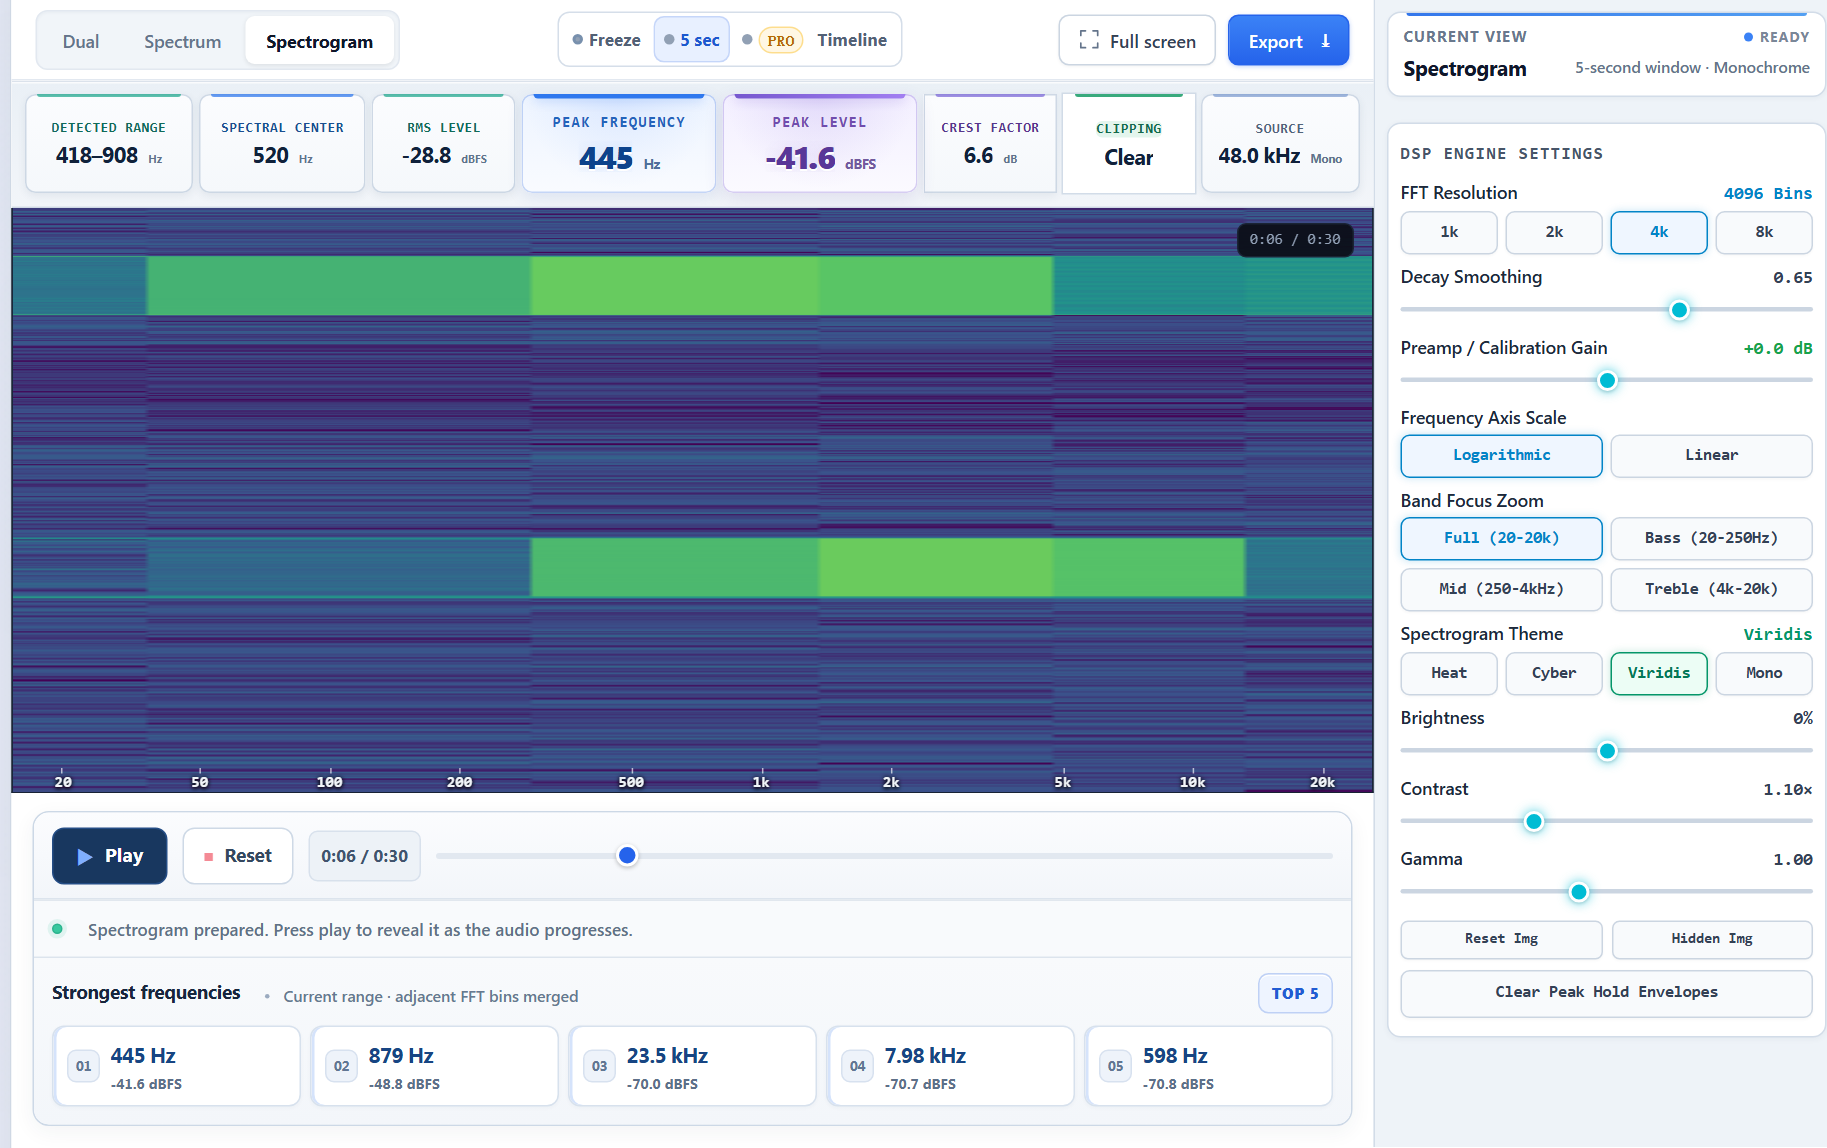
Spectrogram is better for events. It reveals pitch glides, syllables, bird calls, mechanical cycles, edits, dropouts, and musical transitions. It can also expose pictures or text deliberately encoded through frequency content.
The tradeoff is precision: a dense image is excellent for pattern recognition but less convenient for comparing exact amplitudes at many frequencies. Hover readings and CSV export help bridge that gap.
- Following pitch over time
- Locating clicks and dropouts
- Studying speech or animal calls
- Finding hidden spectrogram content
Use both in a repeatable sequence
Begin with Spectrogram to locate the interesting moment. Pause or freeze at that position, switch to Spectrum, and measure the exact peaks. Return to Spectrogram to confirm how long the feature lasts and whether it repeats.
Keep FFT size, scale, channel selection, and playback position consistent when comparing two recordings. A visual difference caused by settings is not a difference in the audio.
You can compare both views on the same recording in the browser-based Spectrum and Spectrogram analyzer.
- 01
Locate the event in Spectrogram
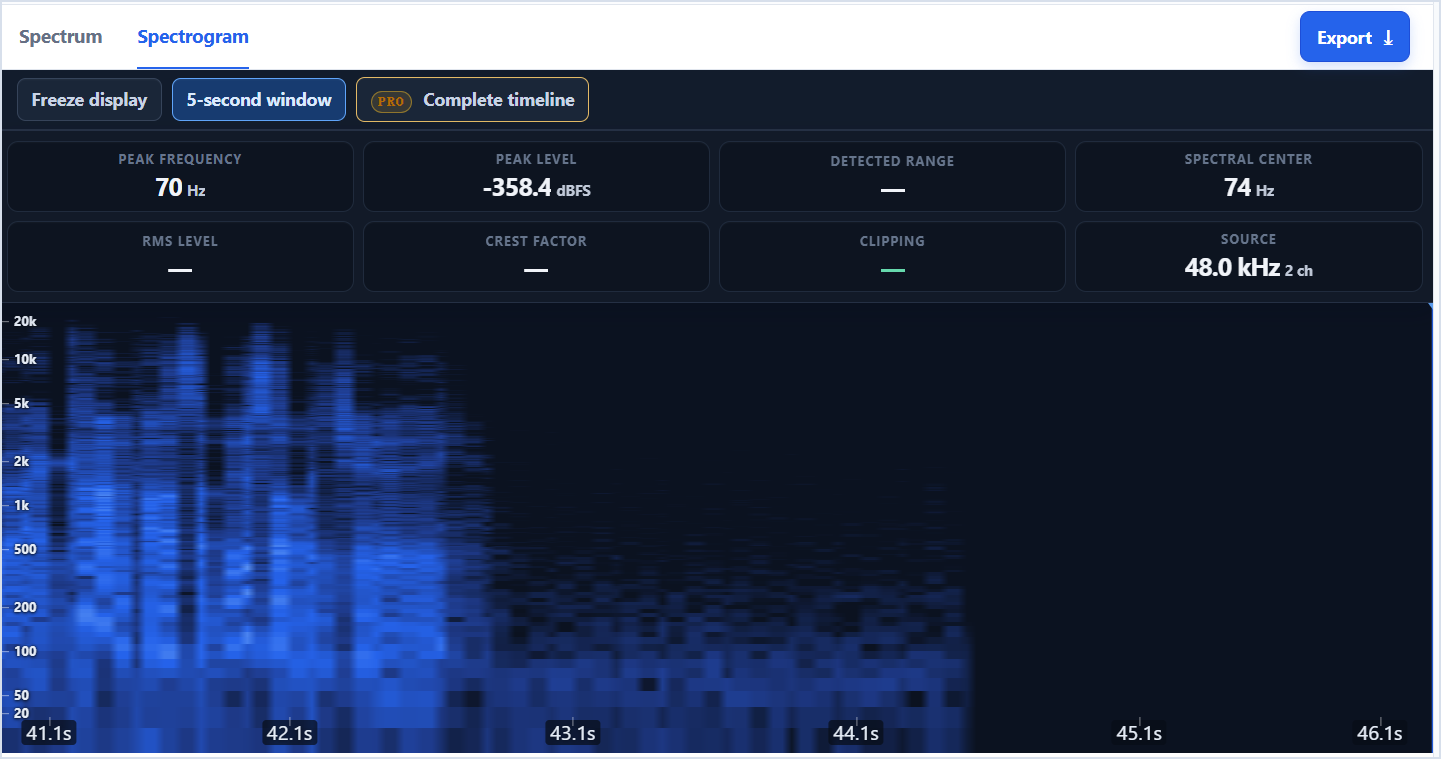
Use the time-frequency view to find when the tone, noise, click, or transition occurs.
- 02
Pause at the same position
Use the playback timeline to hold the exact moment before changing views.

- 03
Switch to Spectrum
Open Spectrum without changing the FFT, channel, or range so the two views describe the same analysis setup.

- 04
Measure the exact peaks
Read Peak frequency and the strongest-frequency list, then return to Spectrogram to confirm duration and repetition.

Common questions
Is a waveform the same as a spectrum?
No. A waveform shows amplitude over time. A spectrum shows the frequency content of a short section of that waveform.
Can I export both views?
Yes. PNG preserves the visual result, while CSV is better for calculations, tables, and reproducible comparison.
Why do the views look different after changing FFT size?
FFT size changes the balance between time and frequency resolution, so narrow peaks and short events are rendered differently.
See the frequencies for yourself.
Upload a file, use the microphone, freeze any moment, and export the result.
Analyze audio