Read the horizontal axis for frequency, the vertical axis for level, then interpret the shape—not just the tallest peak.
Start with the two axes
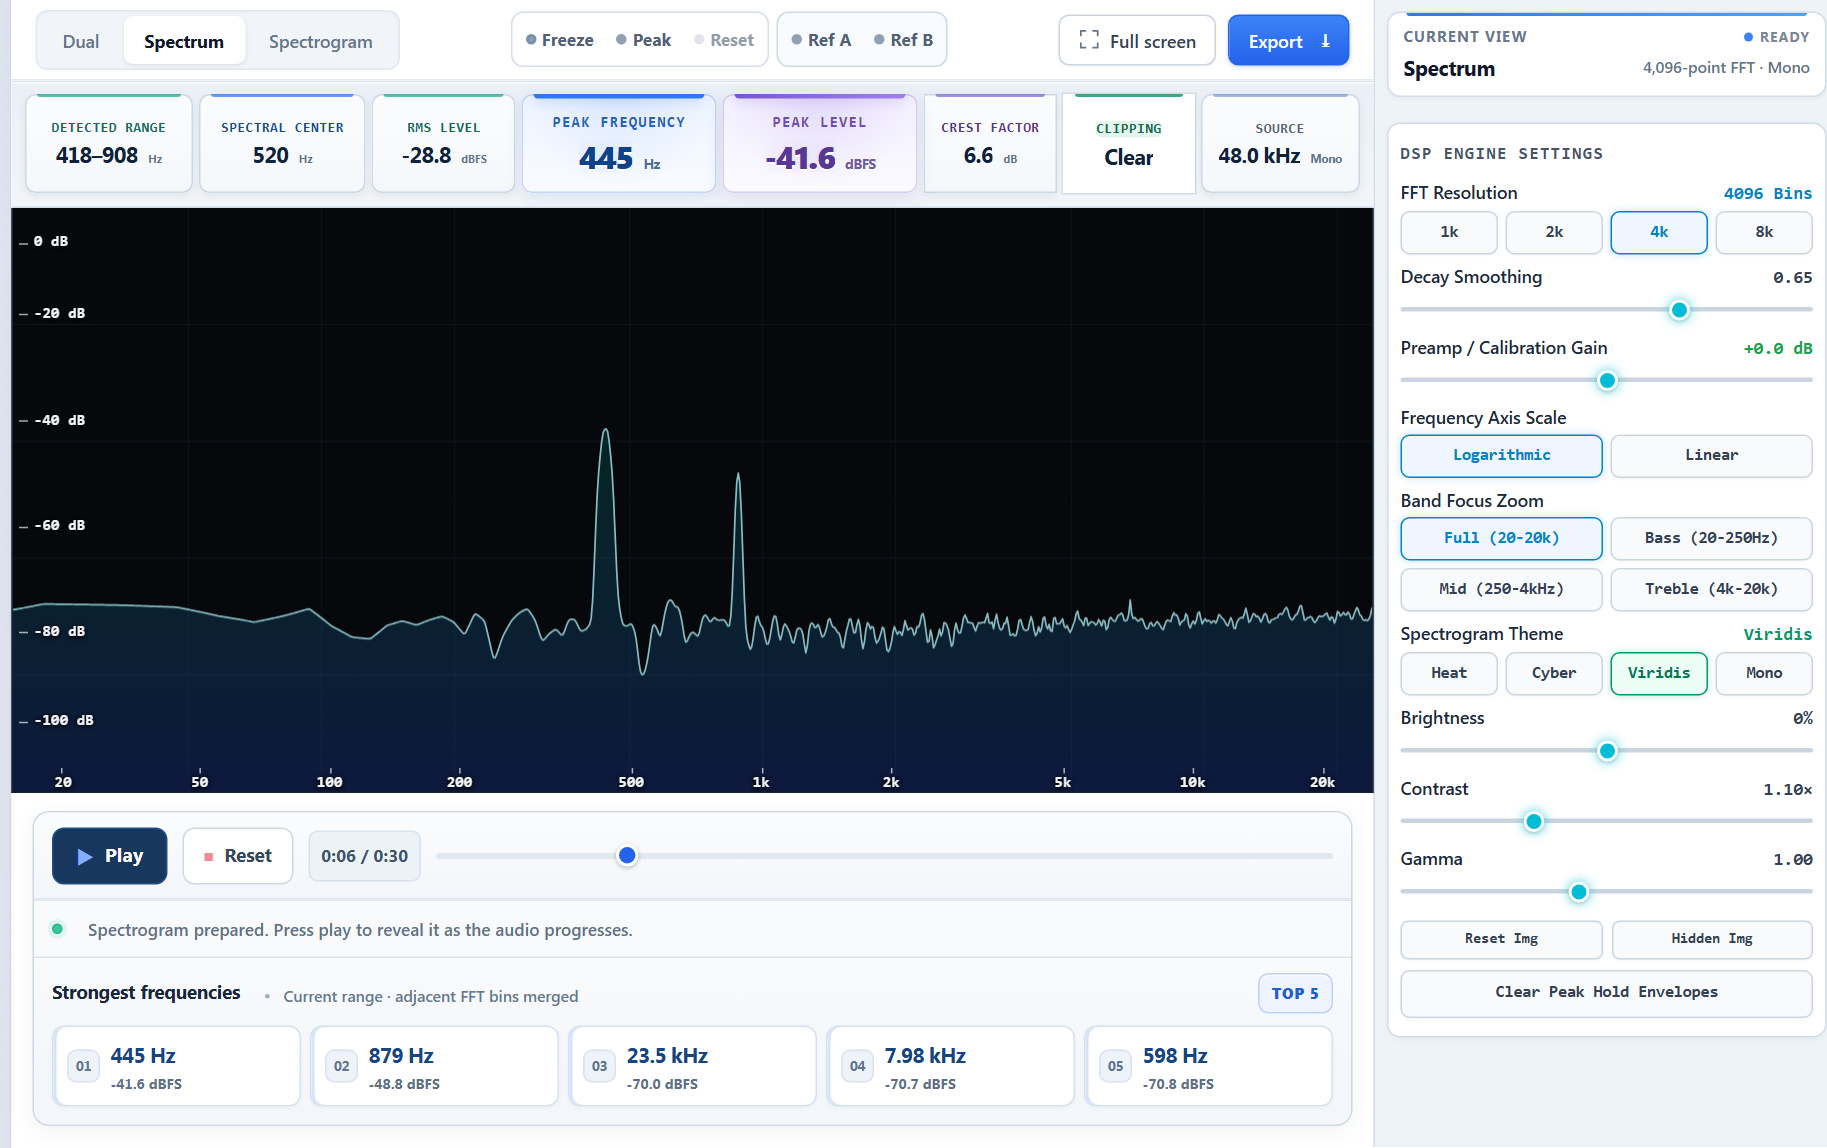
A spectrum analyzer turns a moment of audio into a frequency map. The horizontal axis moves from low frequencies on the left to high frequencies on the right. The vertical axis shows signal level, usually in dBFS for digital audio. A point near 0 dBFS is strong; a point near −90 dBFS is very quiet.
The graph is a snapshot that updates during playback. It answers a precise question: which frequencies are present now, and how strong is each one? It does not show when a sound happened over the full recording—that is the job of a spectrogram.
To follow these readings with your own file or microphone, open the online spectrum analyzer and keep the axes visible while the signal plays.
- 01
Load a representative audio file
Choose a section with the tone, voice, or noise you actually want to inspect.

- 02
Start from balanced settings
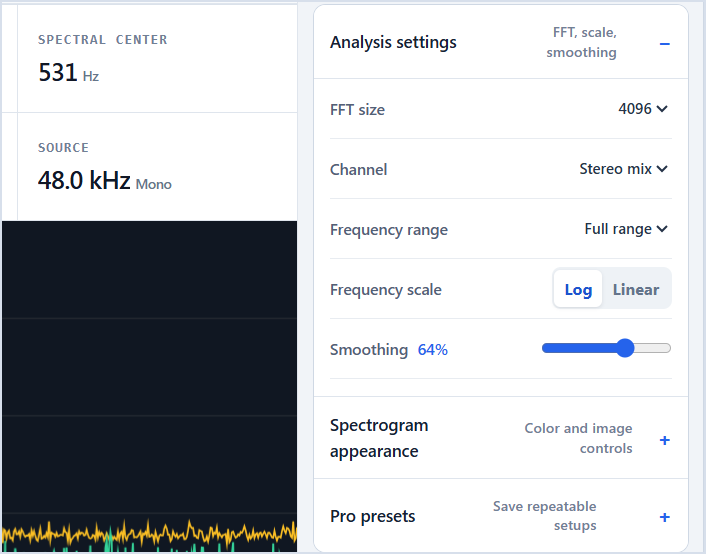
Use FFT 4096, the appropriate channel, Full range, and Log scale before narrowing the view.
- 03
Read frequency and level together
Use the horizontal frequency scale and vertical dB scale, then confirm the numerical Peak frequency and Peak level readouts.

- 04
Check more than the tallest peak
Review the strongest-frequency list and look for related peaks rather than treating one bin as the whole result.

- 05
Hold a changing result
Use Freeze display or Peak hold when the feature is too brief to read reliably during playback.

- 20–250 Hz: sub-bass, bass fundamentals, hum, and low mechanical energy.
- 250 Hz–4 kHz: most vocal information, instrument fundamentals, and intelligibility.
- 4–20 kHz: brightness, sibilance, cymbals, hiss, and fine detail.
Read peaks as relationships
A narrow peak often represents a stable tone. If the strongest peak is at 220 Hz and smaller peaks appear near 440, 660, and 880 Hz, you are probably seeing a fundamental plus harmonics. The fundamental often determines perceived pitch, while the relative strength of the harmonics shapes timbre.
The tallest peak is not always the fundamental. A small speaker, room resonance, filter, or instrument construction can make a harmonic stronger than the note’s base frequency. Look for evenly spaced families of peaks before deciding what the source is.
Understand the floor between peaks
The broad layer beneath distinct peaks is the noise floor. A clean electronic tone may show thin lines over a very low floor. Speech, percussion, wind, and distorted sounds naturally spread energy across wider bands. A wide shape is not automatically a defect.
Use a reference trace when making changes. Save the first spectrum, adjust the recording or processing, and compare the new curve against the reference at the same playback position and level. This is more reliable than comparing from memory.
Choose linear or logarithmic frequency
A logarithmic scale gives more horizontal room to bass and midrange frequencies and resembles how musical pitch is organized. It is the best default for music, speech, and general inspection. A linear scale gives equal width to equal frequency intervals, which makes harmonic spacing, modulation products, and encoded spectrogram art easier to measure.
Finally, check the FFT size. Larger FFT sizes separate nearby steady tones more clearly but blur fast timing changes. Smaller sizes respond faster to transients. Use 4096 as a balanced starting point, then change it only when the task calls for a different tradeoff.
Common questions
What does the highest peak mean?
It is the strongest frequency in the current analysis frame. It may be the fundamental pitch, a harmonic, a resonance, or a narrow noise component, so interpret it with nearby peaks.
Why are all levels negative?
Digital levels are measured relative to 0 dBFS, the maximum representable level. Normal signals sit below zero; more-negative values are quieter.
Why does the spectrum keep moving?
Audio changes from moment to moment. Use smoothing for a steadier view, Freeze Display for inspection, or Peak Hold to retain brief maxima.
See the frequencies for yourself.
Upload a file, use the microphone, freeze any moment, and export the result.
Analyze audio