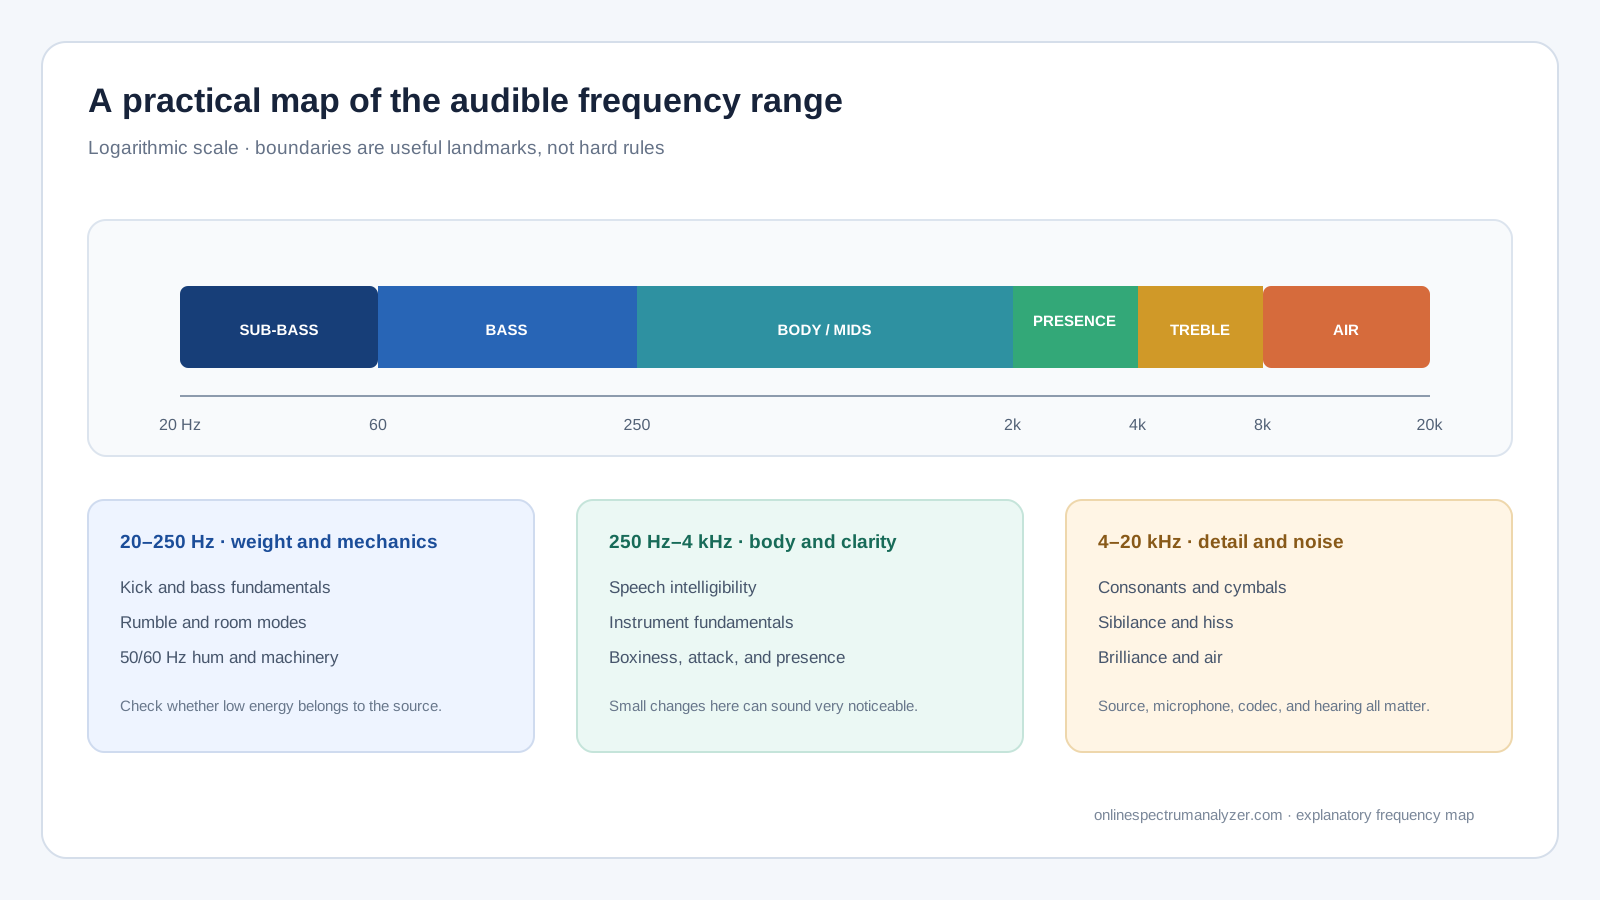
Frequency bands are useful landmarks, not hard borders; fundamentals and harmonics often occupy several bands at once.
20–250 Hz: sub-bass and bass
The lowest audible region carries weight, rumble, kick-drum energy, bass fundamentals, and electrical or mechanical hum. Very low frequencies require more playback capability and may be felt as much as heard. Room modes can make some bass frequencies appear much stronger at one listening position.
A high-pass filter can remove unwanted rumble, but cutting solely because the analyzer shows low-frequency energy can thin the source. Decide whether the energy belongs to the sound before treating it as a problem.
250 Hz–4 kHz: body, presence, and intelligibility
This broad middle range contains many instrument fundamentals and the information that makes speech understandable. Excess energy in the lower mids can sound muddy or boxed-in; too little can make a recording feel hollow. Upper mids add attack and presence but can become harsh when overemphasized.
Human hearing is especially sensitive through much of this region, so a modest spectral change can sound larger than an equally sized change at an extreme frequency. Compare by listening as well as by looking.
4–20 kHz: definition, air, and noise
High frequencies contain consonant detail, cymbal energy, pick noise, hiss, and the sense of air around a recording. Sibilance often appears as brief broadband energy in the upper mids and lower treble rather than one fixed line.
The top visible range depends on sample rate. A 44.1 kHz file can represent frequencies only up to about 22.05 kHz. Microphone response, hearing, and codec filtering may reduce useful information well below that limit.
- 20–60 Hz: sub-bass and rumble
- 60–250 Hz: bass weight and warmth
- 250 Hz–2 kHz: body and core detail
- 2–4 kHz: presence and intelligibility
- 4–8 kHz: definition and sibilance
- 8–20 kHz: brilliance, air, and hiss
Use ranges as a navigation tool
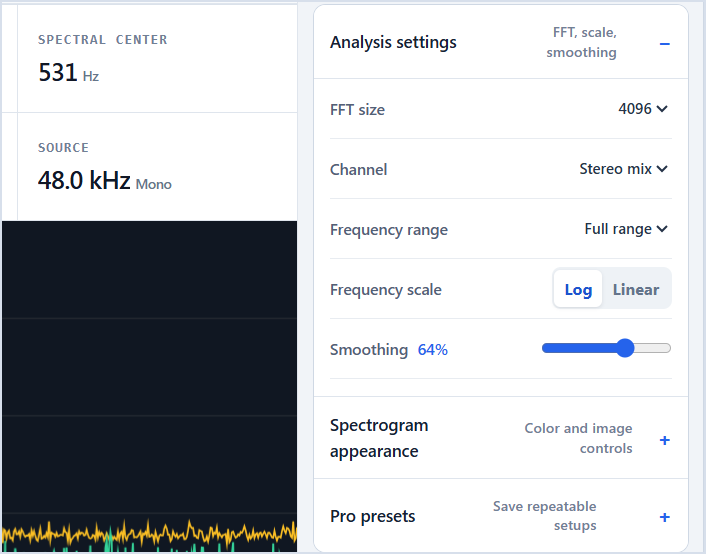
Focus the analyzer on Bass, Vocal, or Treble when a full-range view compresses the area you need. Then return to the full range before concluding, because a low-frequency fundamental can have important harmonics much higher up.
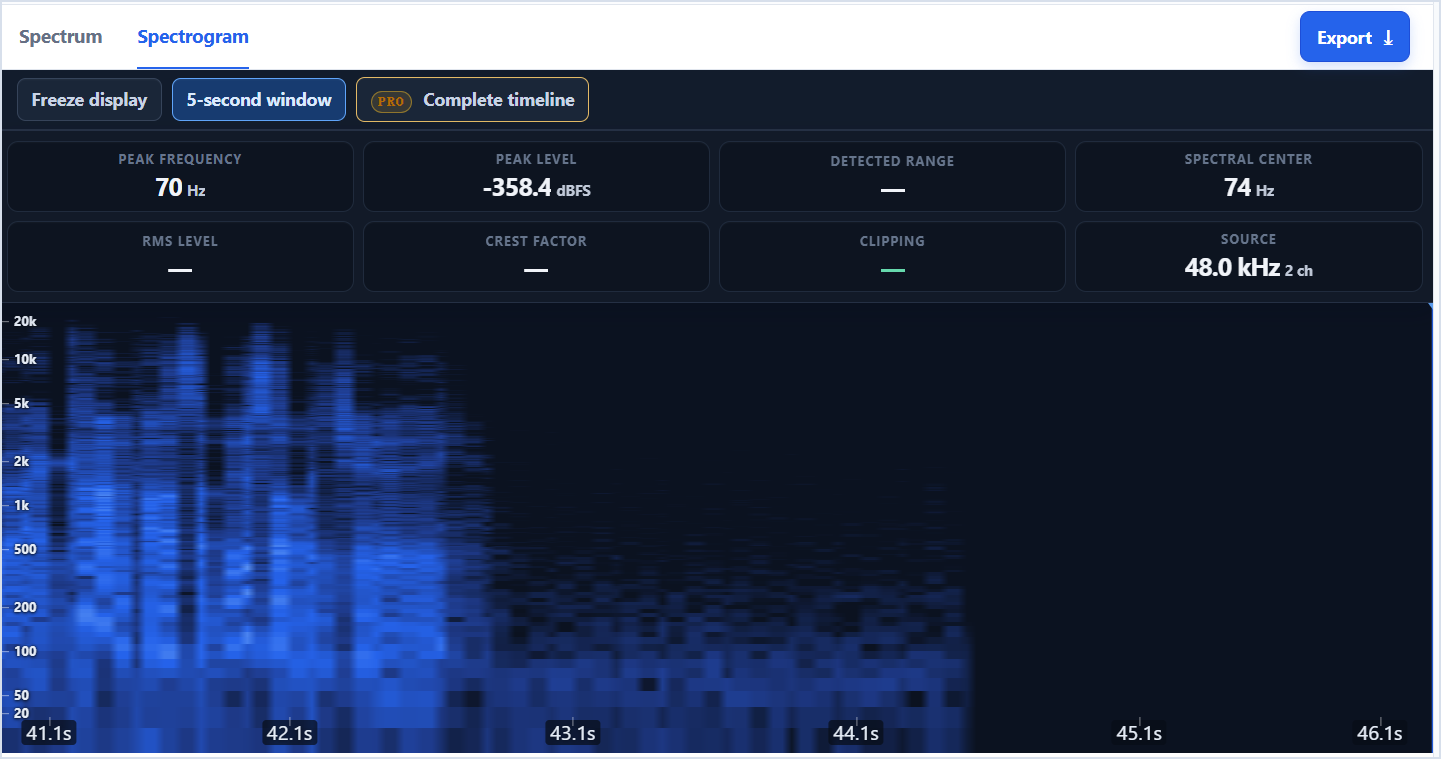
A spectrum shows the balance at one moment; a spectrogram shows whether a band is continuous or appears only during particular events. Using both prevents a short cymbal hit or breath noise from being mistaken for a constant tonal balance.
If you want to hear where these boundaries sit before analyzing a recording, use the online tone generator at a safe listening level.
- 01
Start with Full range
Play a representative passage with Log scale so low, middle, and high-frequency regions remain visible together.
- 02
Identify the strongest area
Use Peak frequency and Detected range to locate the part of the spectrum carrying the most energy.

- 03
Focus the relevant band
Choose Bass, Vocal, or Treble, then inspect the strongest-frequency list inside that range.

- 04
Return to the complete context
Switch back to Full range and use Spectrogram to decide whether the band is continuous or tied to individual events.
Common questions
What is the human hearing range?
It is commonly described as roughly 20 Hz to 20 kHz for young, healthy hearing, but sensitivity varies greatly with age, level, and individual physiology.
Is 440 Hz bass or midrange?
It falls in the midrange. It is also the standard reference frequency commonly used for the musical note A4.
Why is there nothing above 20 kHz?
The source sample rate, recording equipment, codec filters, and the analyzer’s display range limit what can appear there.
See the frequencies for yourself.
Upload a file, use the microphone, freeze any moment, and export the result.
Analyze audio